| T O P I C R E V I E W |
| quinncurtis |
Posted - 28 Oct 2020 : 11:17:07
I would like to ask can I change the colour of the autoNormalCurve to dark blue? Also, is it possible for me to change the control limit line values to string instead? Thank you in advance : |
| 1 L A T E S T R E P L I E S (Newest First) |
| quinncurtis |
Posted - 28 Oct 2020 : 11:24:00
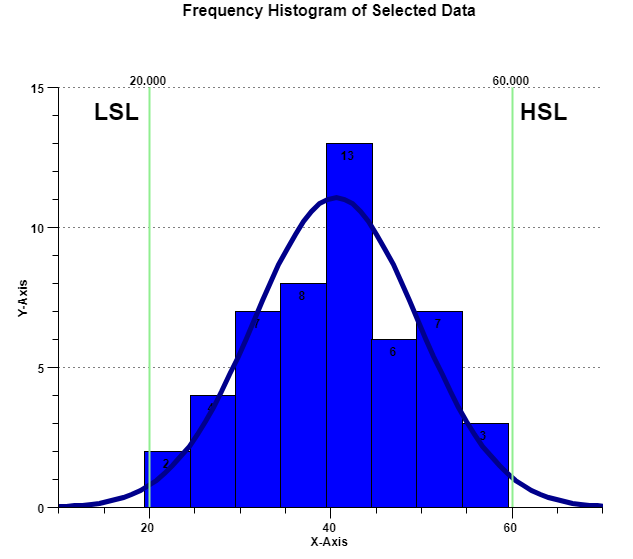
You can change the color and linestyle of the autoNormal curve using the code below. If you add the control lines, the numeric strings designating their value come along with them. There is no option to remove them. However, you can just add your own string captions at the appropriate position. See the modified version of our FrequencyHistogramChart example below.
async BuildFrequencyHistogramChart(canvasid) {
let htmlcanvas = document.getElementById(canvasid);
let charttitle = "Frequency Histogram Example";
let frequencyHistogramchart = QCSPCChartTS.FrequencyHistogramChart.newFrequencyHistogramChart(htmlcanvas);
if (!frequencyHistogramchart)
return;
// Frequency bins
let freqLimits = [19.5, 24.5, 29.5, 34.5, 39.5, 44.5, 49.5, 54.5, 59.5];
// data to be sorted into frequency bins
let freqValues = [32, 44, 44, 42, 57,
26, 51, 23, 33, 27,
42, 46, 43, 45, 44,
53, 37, 25, 38, 44,
36, 40, 36, 48, 56,
47, 40, 58, 45, 38,
32, 39, 43, 31, 45,
41, 37, 31, 39, 33,
20, 50, 33, 50, 51,
28, 51, 40, 52, 43];
frequencyHistogramchart.initFrequencyHistogram(freqLimits, freqValues);
frequencyHistogramchart.setPreferredSize(800, 600);
// Set bar orientation
frequencyHistogramchart.MainTitle.TextString = "Frequency Histogram of Selected Data";
// Build chart
frequencyHistogramchart.ChartOrientation = QCSPCChartTS.ChartConstants.VERT_DIR;
frequencyHistogramchart.BarFillColor = QCSPCChartTS.ChartColor.LIGHTCORAL;
frequencyHistogramchart.FrequencyHistogramPlot.setSegmentFillColor(4, QCSPCChartTS.ChartColor.BLUE);
frequencyHistogramchart.addFrequencyHistogramControlLine(20.0, QCSPCChartTS.ChartAttribute.newChartAttributeColorWidth(QCSPCChartTS.ChartColor.LIGHTGREEN, 2));
frequencyHistogramchart.addFrequencyHistogramControlLine(60.0, QCSPCChartTS.ChartAttribute.newChartAttributeColorWidth(QCSPCChartTS.ChartColor.LIGHTGREEN, 2));
frequencyHistogramchart.AutoNormalCurve = true;
// Set Normal curve attributes
frequencyHistogramchart.NormalCurveAttribute.PrimaryColor = QCSPCChartTS.ChartColor.DARKBLUE;
frequencyHistogramchart.NormalCurveAttribute.LineWidth = 5;
// Set axes strings
frequencyHistogramchart.XAxisTitle.TextString = "X-Axis";
frequencyHistogramchart.YAxisTitle.TextString = "Y-Axis";
frequencyHistogramchart.buildChart();
let i = 0;
for (i = 0; i < 9; i++) {
frequencyHistogramchart.FrequencyHistogramPlot.setSegmentFillColor(i, QCSPCChartTS.ChartColor.BLUE);
frequencyHistogramchart.FrequencyHistogramPlot.setSegmentLineColor(i, QCSPCChartTS.ChartColor.BLACK);
}
// Add these after the .buildChart() call, but before the .updateDraw() call below.
// Add your own captions using the charts physical coordinates
let captionFont = QCSPCChartTS.ChartFont.newChartFont("Arial", QCSPCChartTS.ChartFont.BOLD, 24);
let y1 = frequencyHistogramchart.CoordinateSystem.ScaleMaxY;
let x1 = 20;
let x2 = 60;
let caption1 = QCSPCChartTS.ChartText.newChartText(frequencyHistogramchart.CoordinateSystem, captionFont, "LSL", x1, y1, QCSPCChartTS.ChartConstants.PHYS_POS);
caption1.setXJust(QCSPCChartTS.ChartConstants.JUSTIFY_MAX);
caption1.setYJust(QCSPCChartTS.ChartConstants.JUSTIFY_MAX);
caption1.setTextNudge(-8, 8);
frequencyHistogramchart.addChartObject(caption1);
let caption2 = QCSPCChartTS.ChartText.newChartText(frequencyHistogramchart.CoordinateSystem, captionFont, "HSL", x2, y1, QCSPCChartTS.ChartConstants.PHYS_POS);
caption2.setXJust(QCSPCChartTS.ChartConstants.JUSTIFY_MIN);
caption2.setYJust(QCSPCChartTS.ChartConstants.JUSTIFY_MAX);
caption2.setTextNudge(8, 8);
frequencyHistogramchart.addChartObject(caption2);
frequencyHistogramchart.updateDraw();
}
|
|
|
