| Author |
 Topic Topic  |
|
|
mikebsr
13 Posts |
 Posted - 03 May 2008 : 16:39:39 Posted - 03 May 2008 : 16:39:39


|
When looking at a range chart (in my case, a batch variable chart), the first point in the range chart is always the value of the first data point (the difference from zero) - as it should be. My question is, is when the control limits for the range chart are calculated, is that first point thrown out?
I don't see any problems with the chart, but want to give my customers a good answer.
Thanks! |
|
|
quinncurtis
1164 Posts |
Posted - 03 May 2008 : 17:10:11
|
Are you referring to an Individual-Range chart ? X-Bar R, Median-Range charts also have Range charts.
For an I-R chart, the value of the range chart at index 0 is 0.0, not the value of the data point. That's what our examples show. Did you misstate that, or do you have a contrary example?
Since the first value always 0.0, the mean of the range values excludes that data value and starts at index 1 instead. |
 |
|
|
mikebsr
13 Posts |
Posted - 04 May 2008 : 16:25:34
|
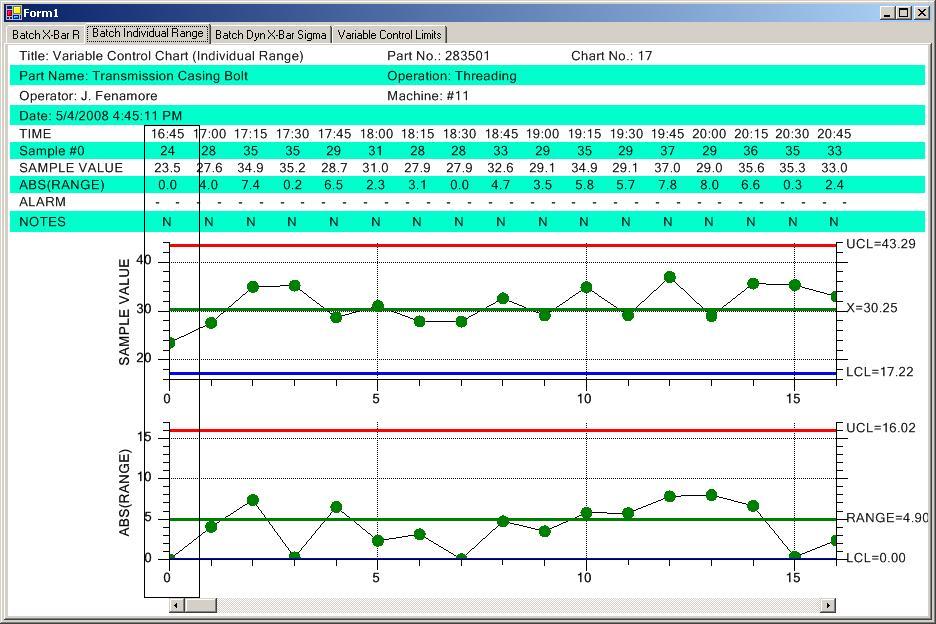
I'm using a SPCBatchVariableControlChart with a sub group size of 1.
I think I'm referring to an individual range chart. The top chart contains the sample values and the bottom the ABS(Range) values.
Let's say all my values are somewhere between 1 and 10. And the first value is 5. Because the range of the first reading is 5 (five minus zero), the first range value looks like a spike. Assuming all the other values float somewhere around 5, I might have pretty tight control limits. So, when a customer looks at the chart, the first value looks like a flier even though it is correct.
So, if all the values are between 5 and 5.5 (range values around .5), the range values will be very small as compared to the first range value. If the first value is used as part of the control limit calculation, it would seem to skew the control limits value. My question is, is this first value used to calculate the range control limits?
It's not critical - I'm just trying to learn something here as everything appears to be working great. |
|
|
|
quinncurtis
1164 Posts |
Posted - 04 May 2008 : 16:52:54
|
We don't know what you are referring to. In our own examples, TimeVariableControlCharts.IndividualRangeChart and BatchVariableControlCharts.BatchIndividualRangeChart, the range value at the first sample interval is 0.0. It shows up in the chart as 0.0, and in the table as 0.0. The first range value is actually undefined, because there is no previous value to calculate the range against, and by default we set it to 0. Are you or are you not seeing a value of 0.0 as the first value in the bottom chart (RANGE) of the two examples we site above? Are our example programs somehow acting differently than your own?
|
|
|
| |
Topic |
|
|
|