| T O P I C R E V I E W |
| seh-a |
Posted - 08 Dec 2014 : 13:47:05
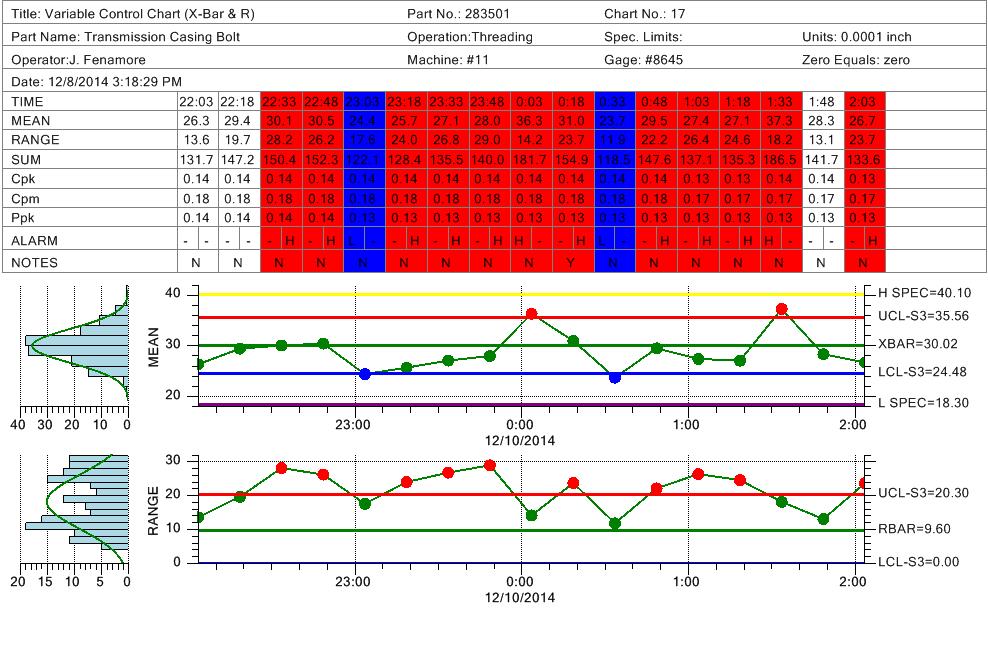
We have recently upgraded from v2.0 to v2.3 and are doing regression test. One things we noticed is that the color of the plots are different. This has to do with the control limits. In order to explain this, let's make an example. Let's say we have USL of 3, UCL of 2, LSL of -3, and LCL of -2. We compile and link our application with v2.0, the plots show points that are greater than 3 and less than -3 (out of spec) with red color, points between 2 and 3 and between -2 and -3 with blue color (out of control) with blue color. However, if we compile and link with v2.3 (no code modification) points greater than 3 show blue as in points between 2 and 3. Further more, points less than -2 and -3 are all green (not out of control/spec) Do we have to change settings or code to make it work the way it was? |
| 3 L A T E S T R E P L I E S (Newest First) |
| quinncurtis |
Posted - 09 Dec 2014 : 11:18:38
Yes, it still works. But the symbol color does not track the line color of the alarm. If it is any greater than (>) alarm then the symbol goes RED, and if a less than alarm (<) it goes BLUE, otherwise it is GREEN. So if you have 2 or 3 greater than alarms, it will go RED when you pass the first limit, and stay RED for the other > limits. This was finalized probably 4 years ago.
You can change those default symbol colors (RED and BLUE), but all > alarms will be specific color, and < alarms another. There are other colors associated with more esoteric alarms found in the Named Control Rules, such as trending, and banding. |
| seh-a |
Posted - 09 Dec 2014 : 10:32:18
I think the problem could be that we use our own set of limits, not the default +/- 3 sigma. We added limits using AddAdditionalControlLimit method and use SPCChartObjects.GetControlLimitData(...LIMIT).LinePlot.LineColor = Color.Red (example). Doesn't this work anymore? |
| quinncurtis |
Posted - 08 Dec 2014 : 15:11:57
The way it should display is that inside the +-3 sigma control limits it should be the default green color, above the +3 control limit it should be the default red, and below the -3 limit it should be the default blue. This matches the way it displays in the table. The Spec limits should be outside the +-3 sigma control limits. There is no special change for exceeding the spec limits, it just continues the >+3 sigma color, or the <-3 sigma color. The symbol colors are not based on the actual color of the limit, rather the type of control limit test (i.e. a greater than UCL condition is red, a less than LCL condition is blue), and inbetween is the default symbol color. Our tests using our example programs confirm this behavior.
It does not sound like what you describe. It may be that in order to get the behavior you wanted in Rev. 2.0 you did something in the setup which is no longer appropriate. In order to investigate you need to supply us with a simple example which demonstrates the behavior you describe. You can zip together a simple example projects and send it to support@quinn-curtis.com.
|
|
|
