
QCChart2DJSTS
QCChart2D Charting Tools for JavaScript/TypeScript
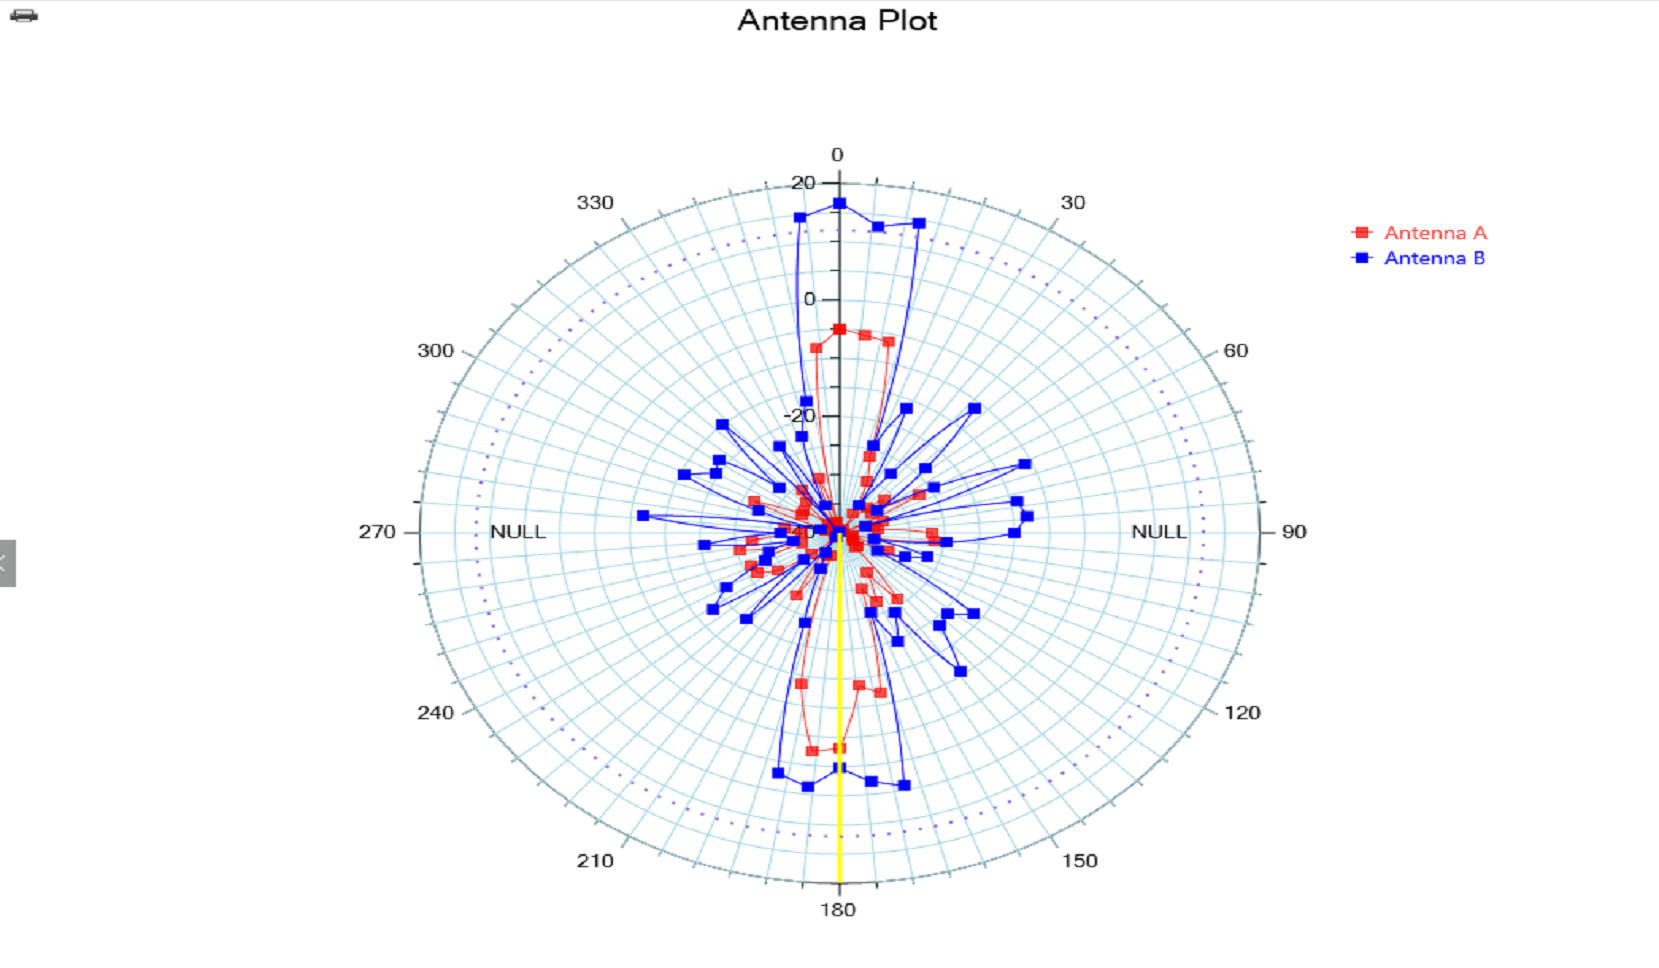
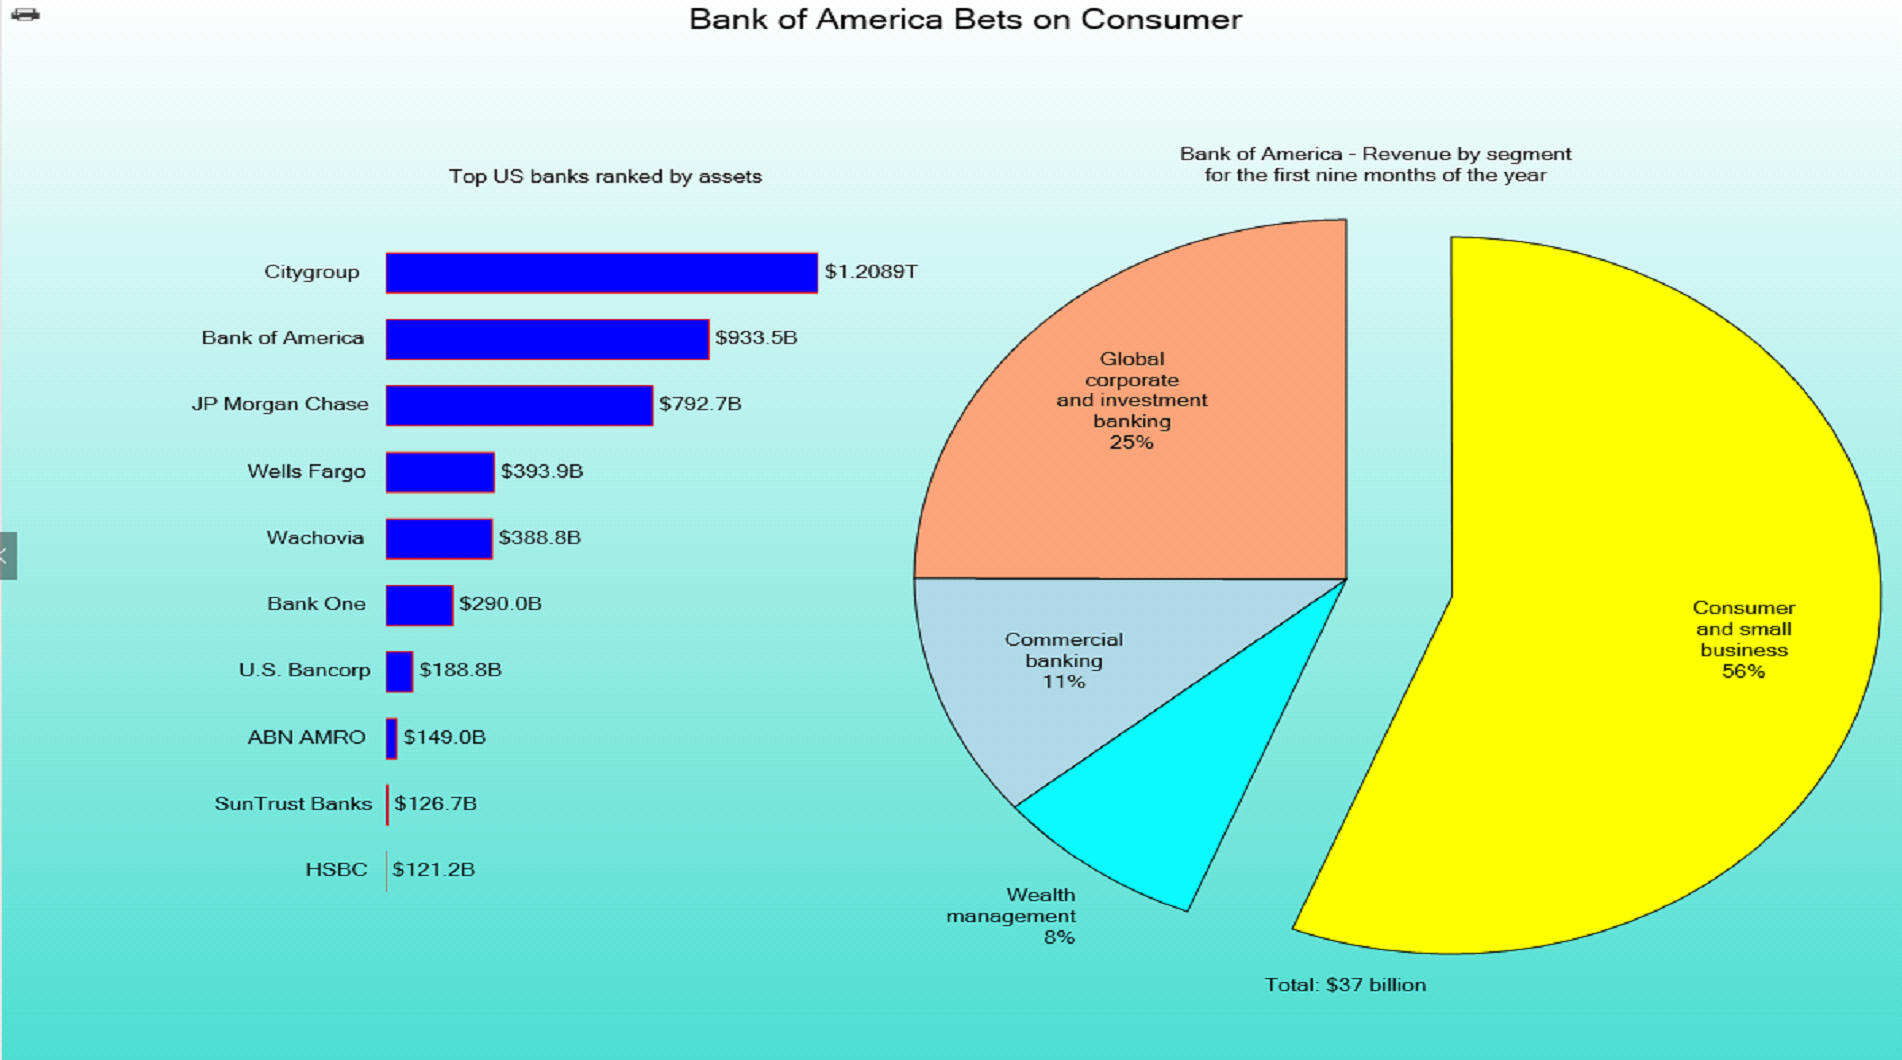
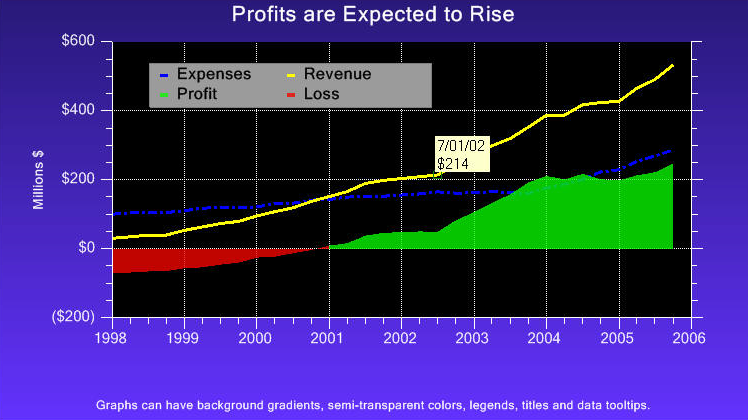
Add high-speed line plots, bar plots, scatter plots, open-high-low-close plots, candlestick plots, bubble plots, histogram plots, polar plots, antenna plots, ring charts, and pie charts, to web applications.
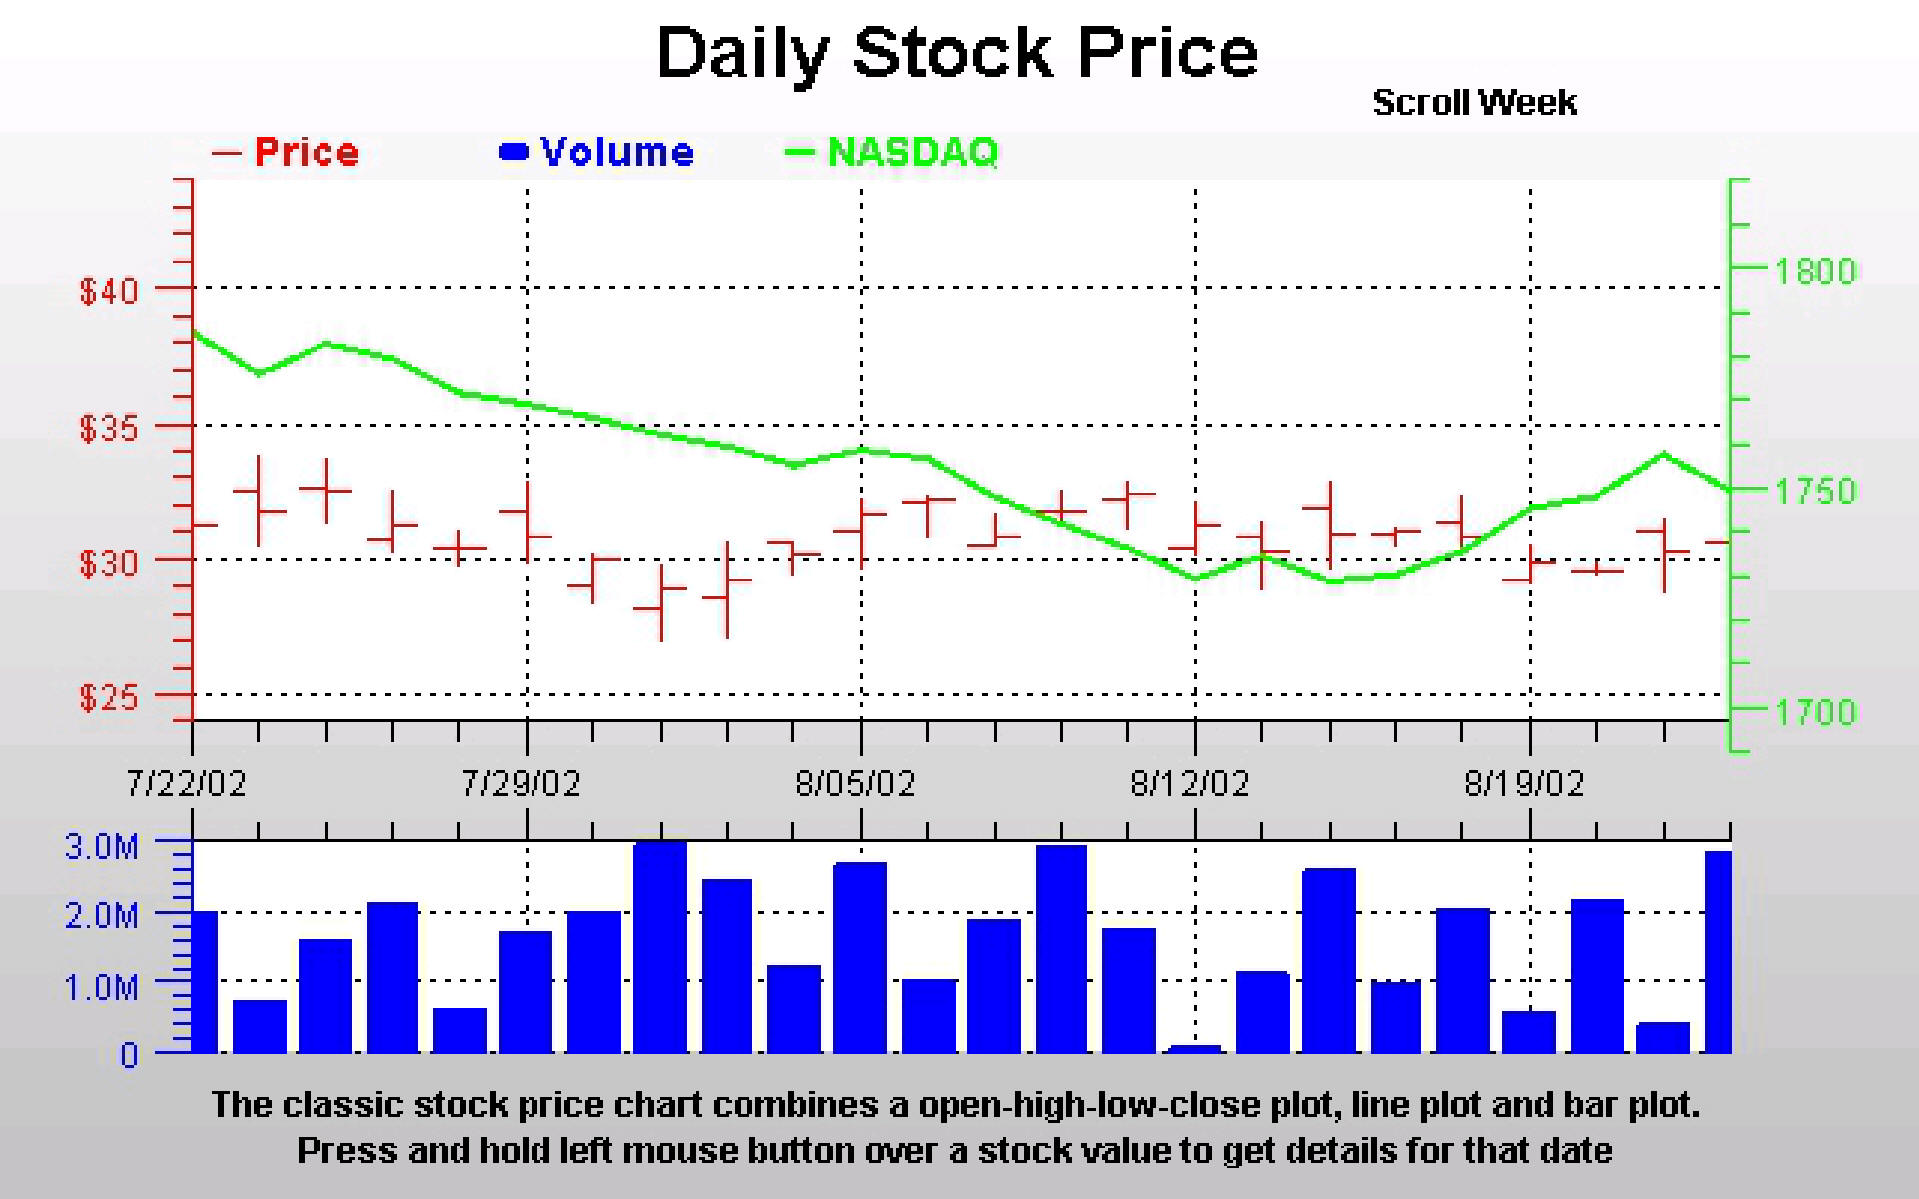
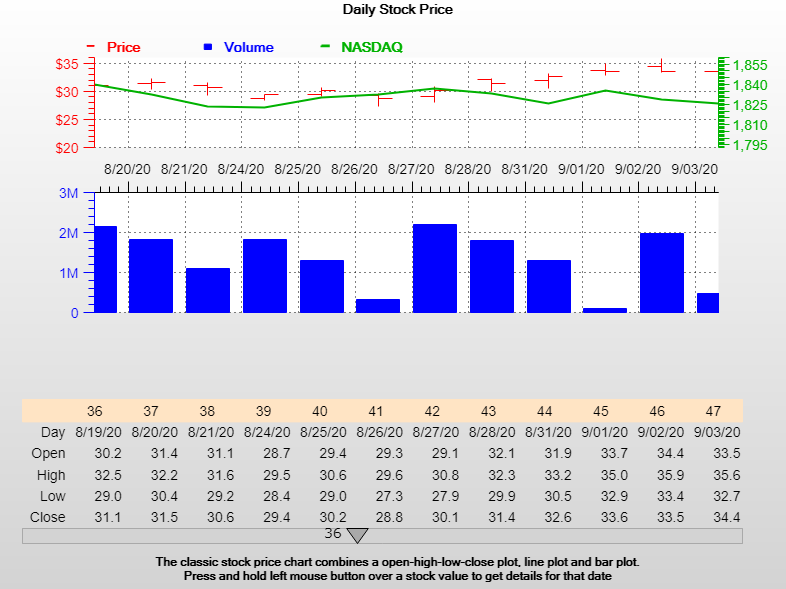
Above is an interactive OHLC Chart with scroll bar and data tooltips.
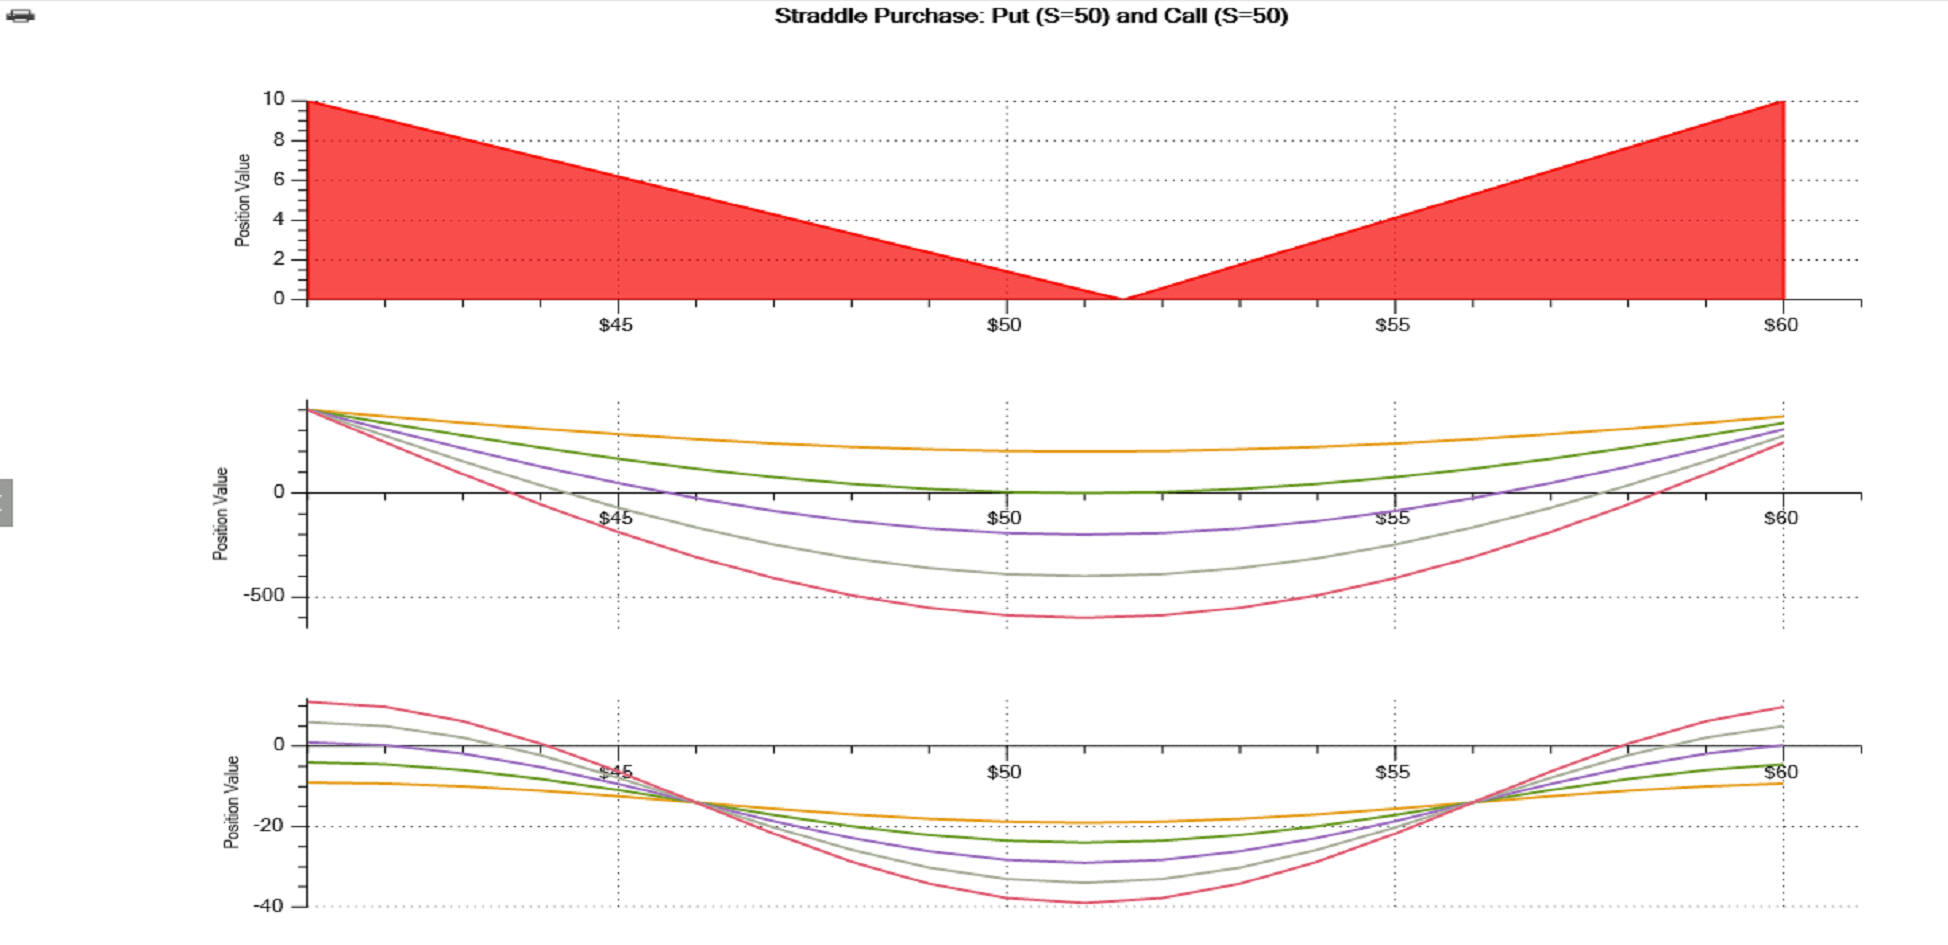
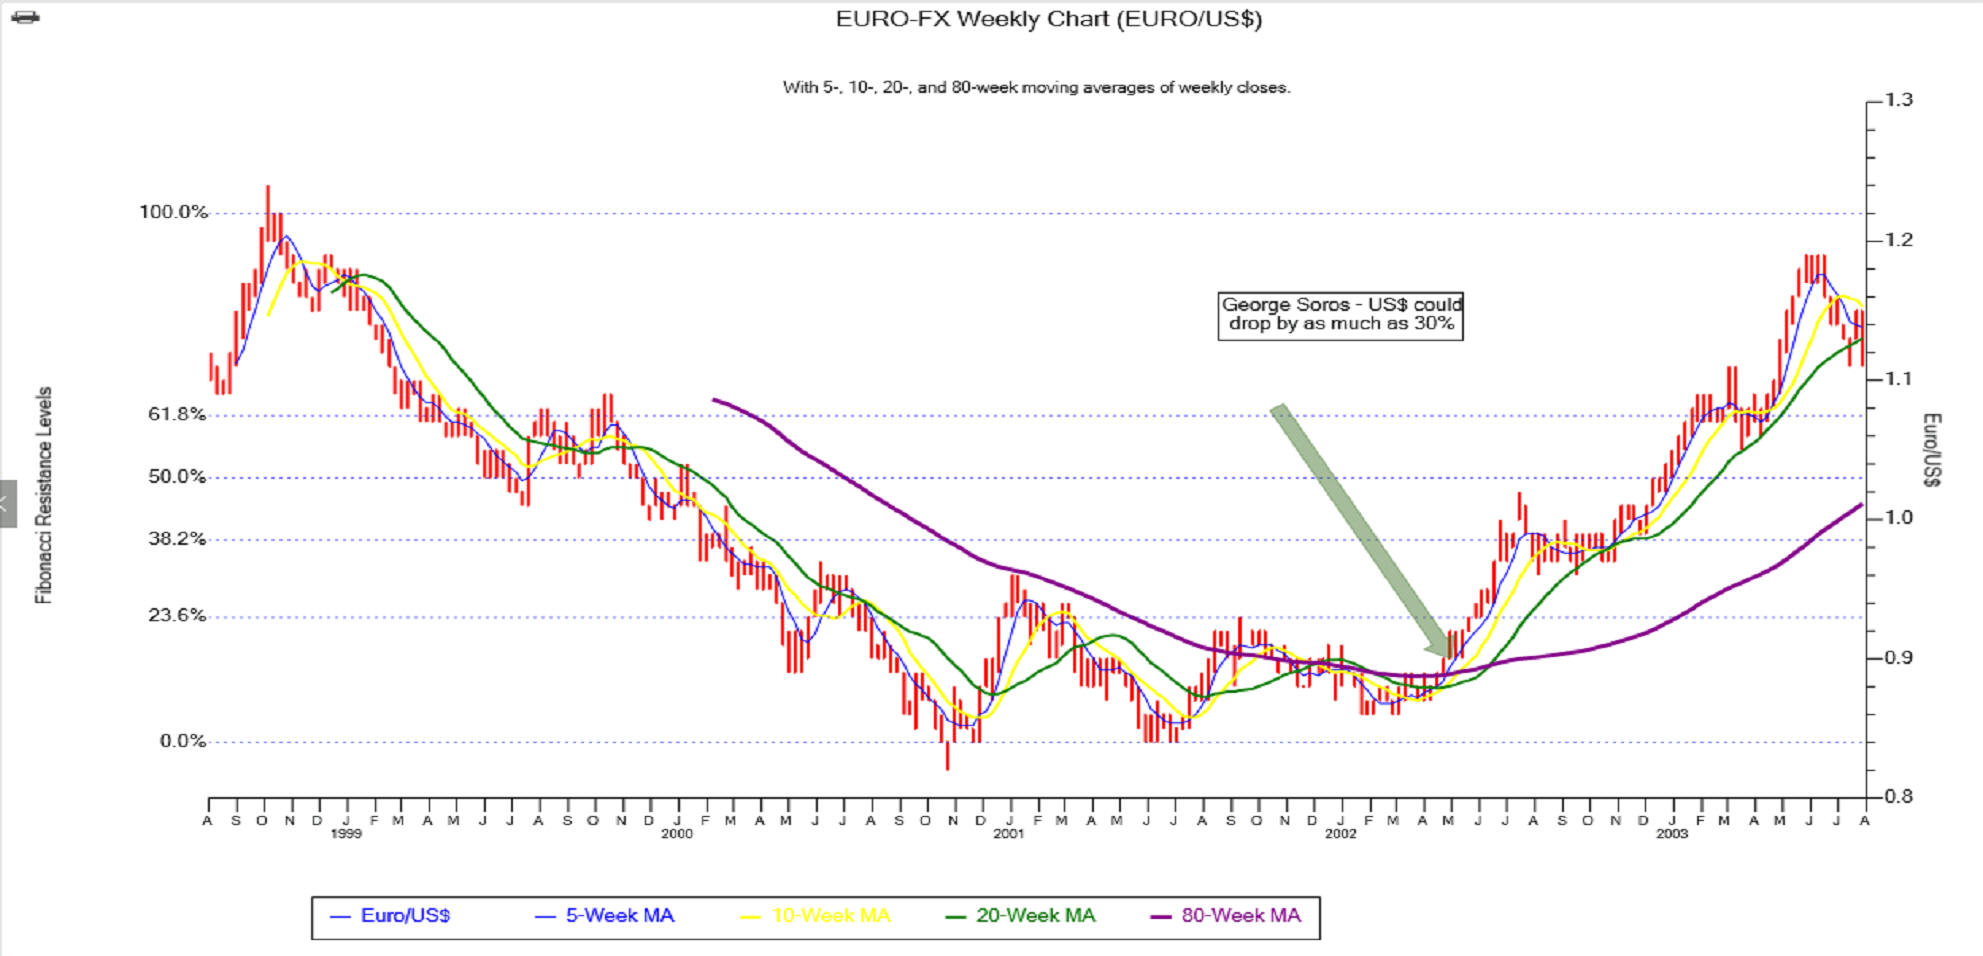
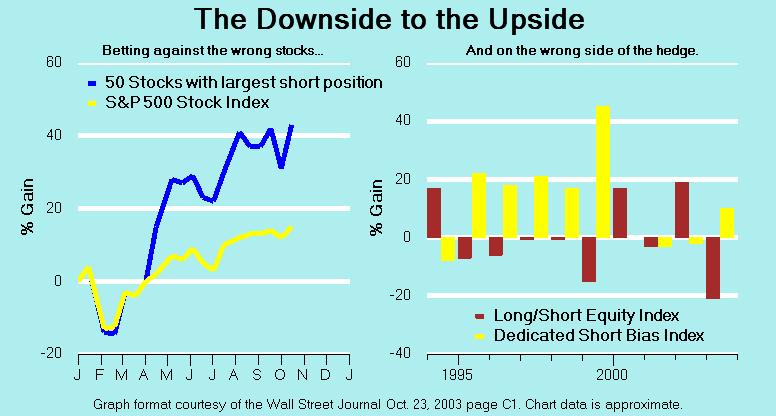
Financial and Stock Charting


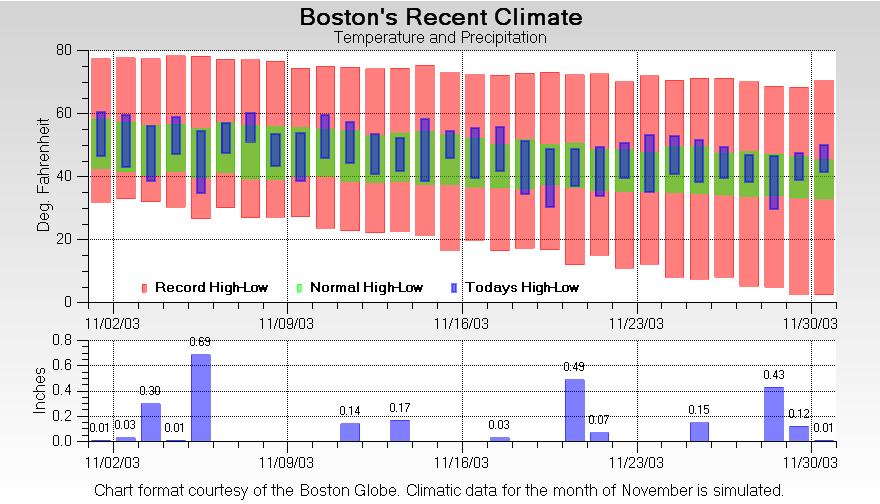
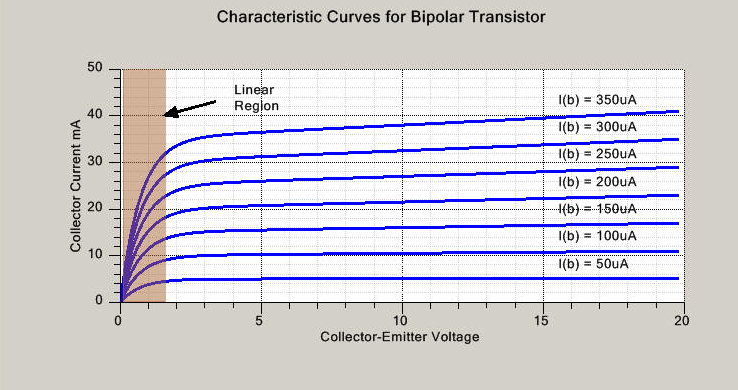
Engineering, Medical Charting and Graphics

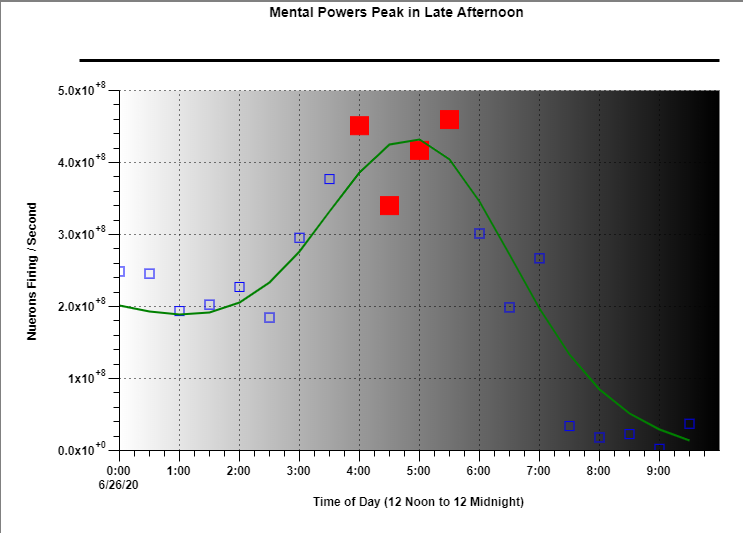

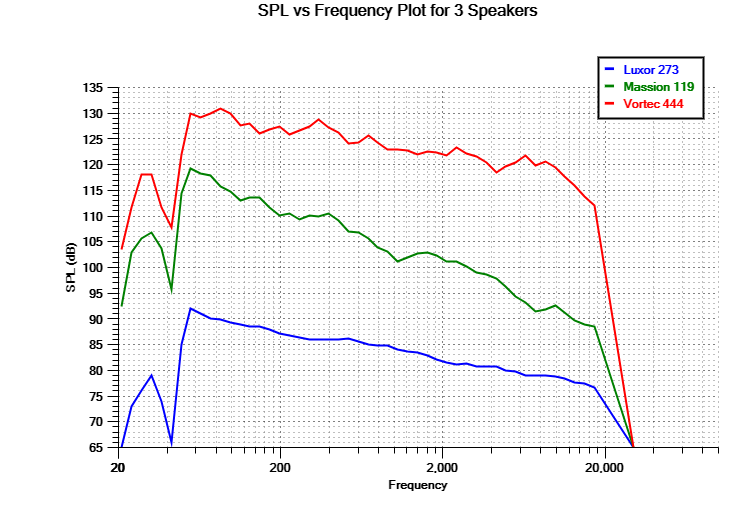
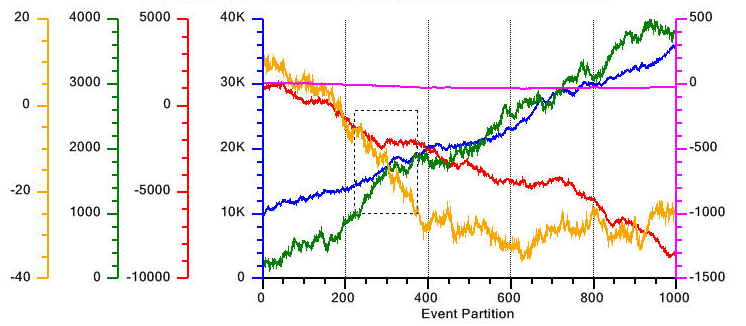
Scientific Charting and Data Visualization

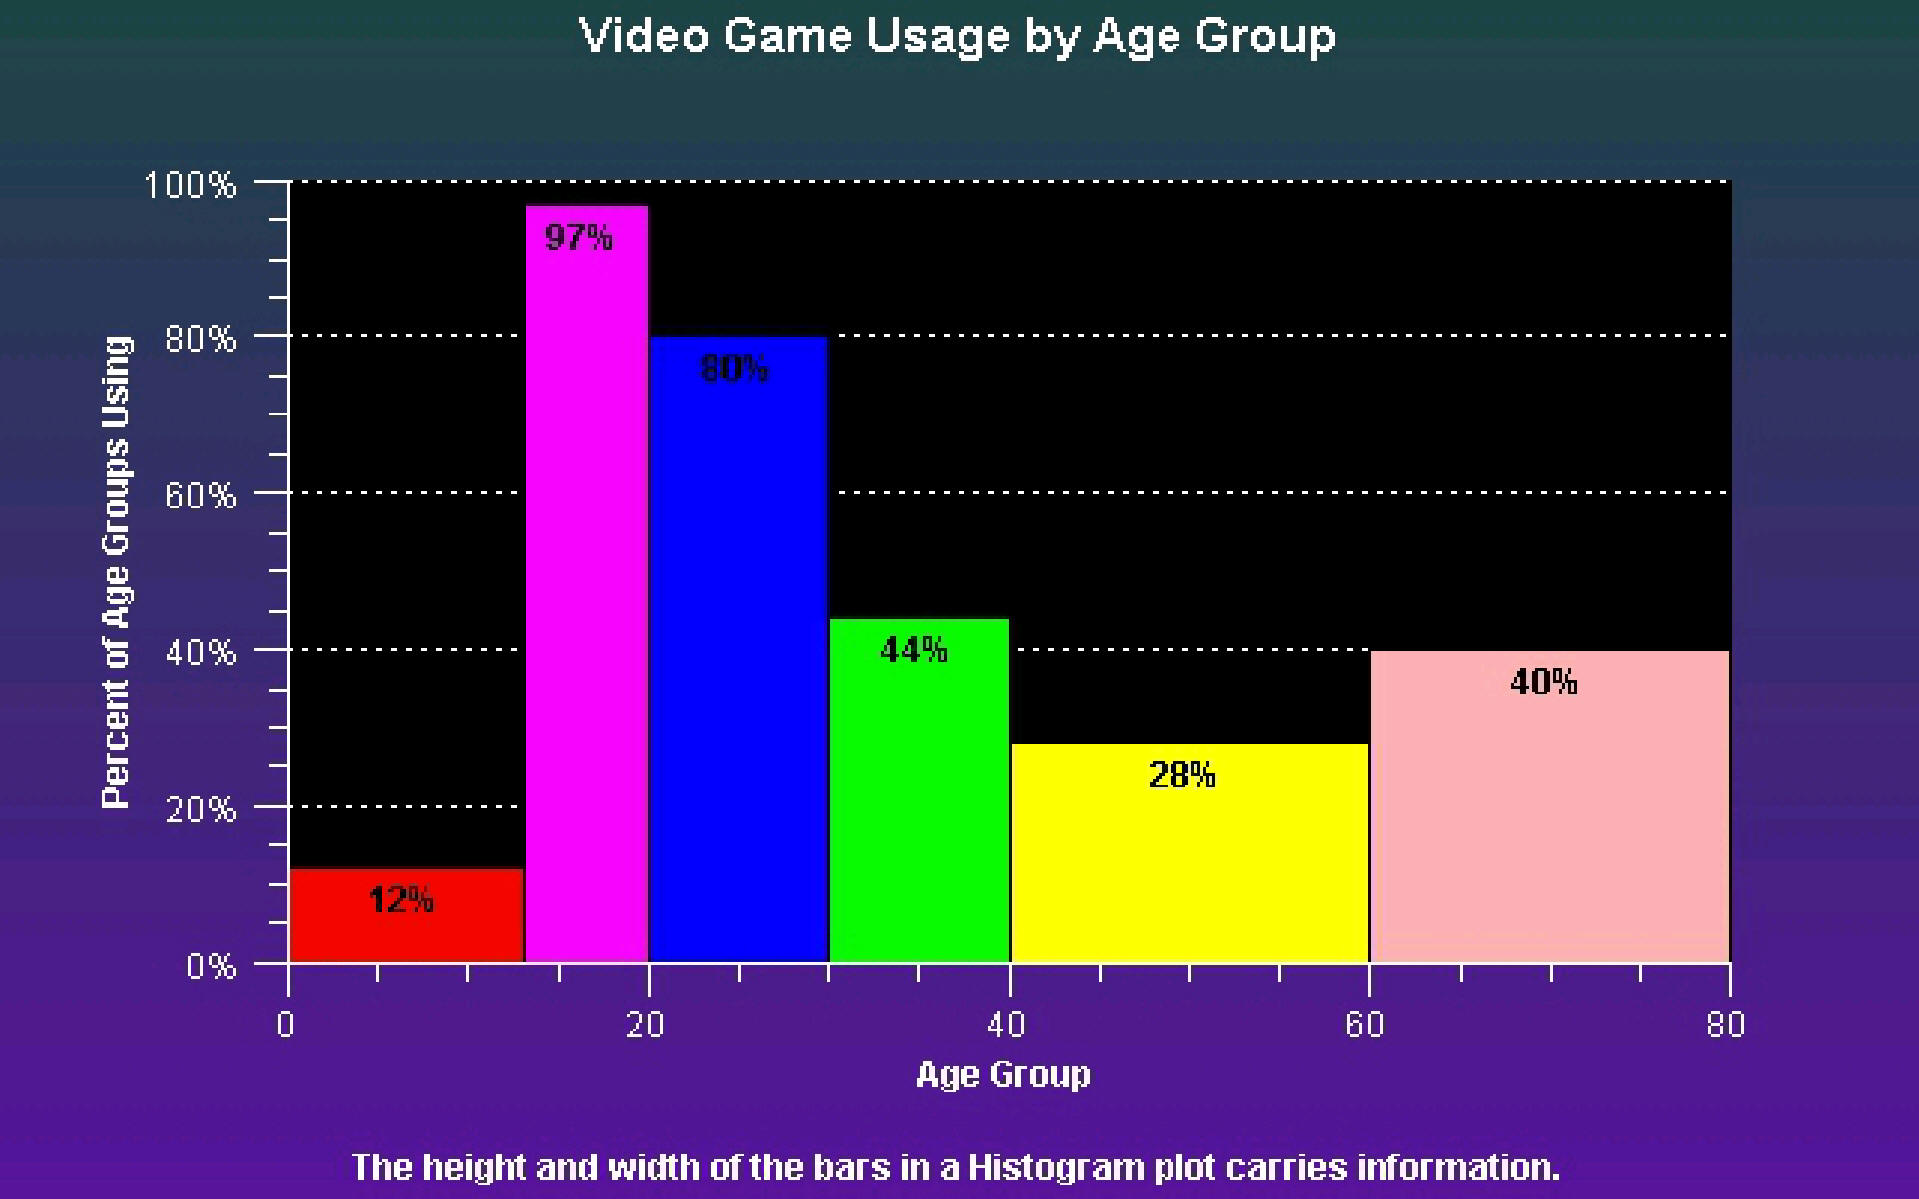
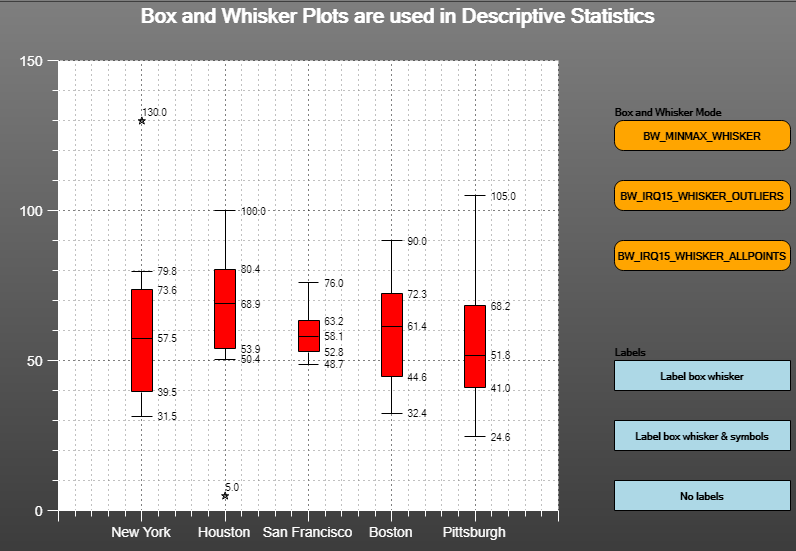
Statistical Charting
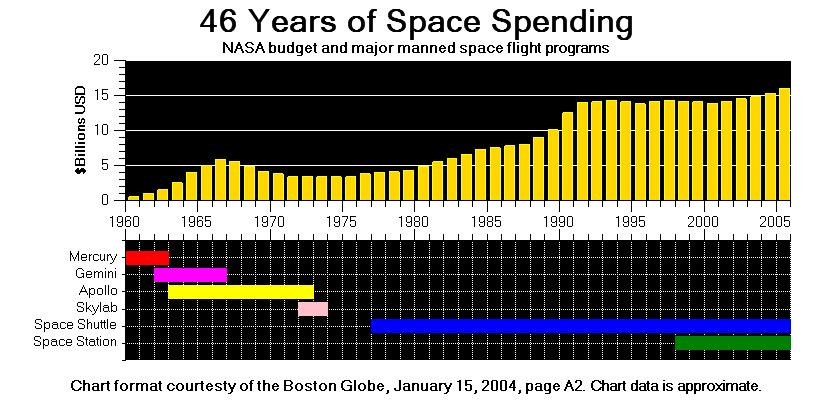
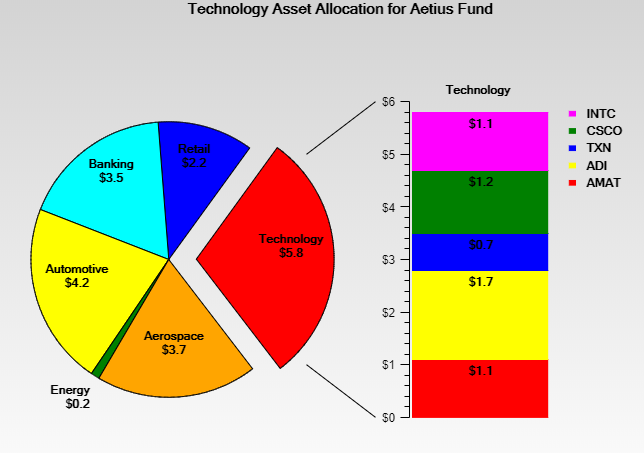
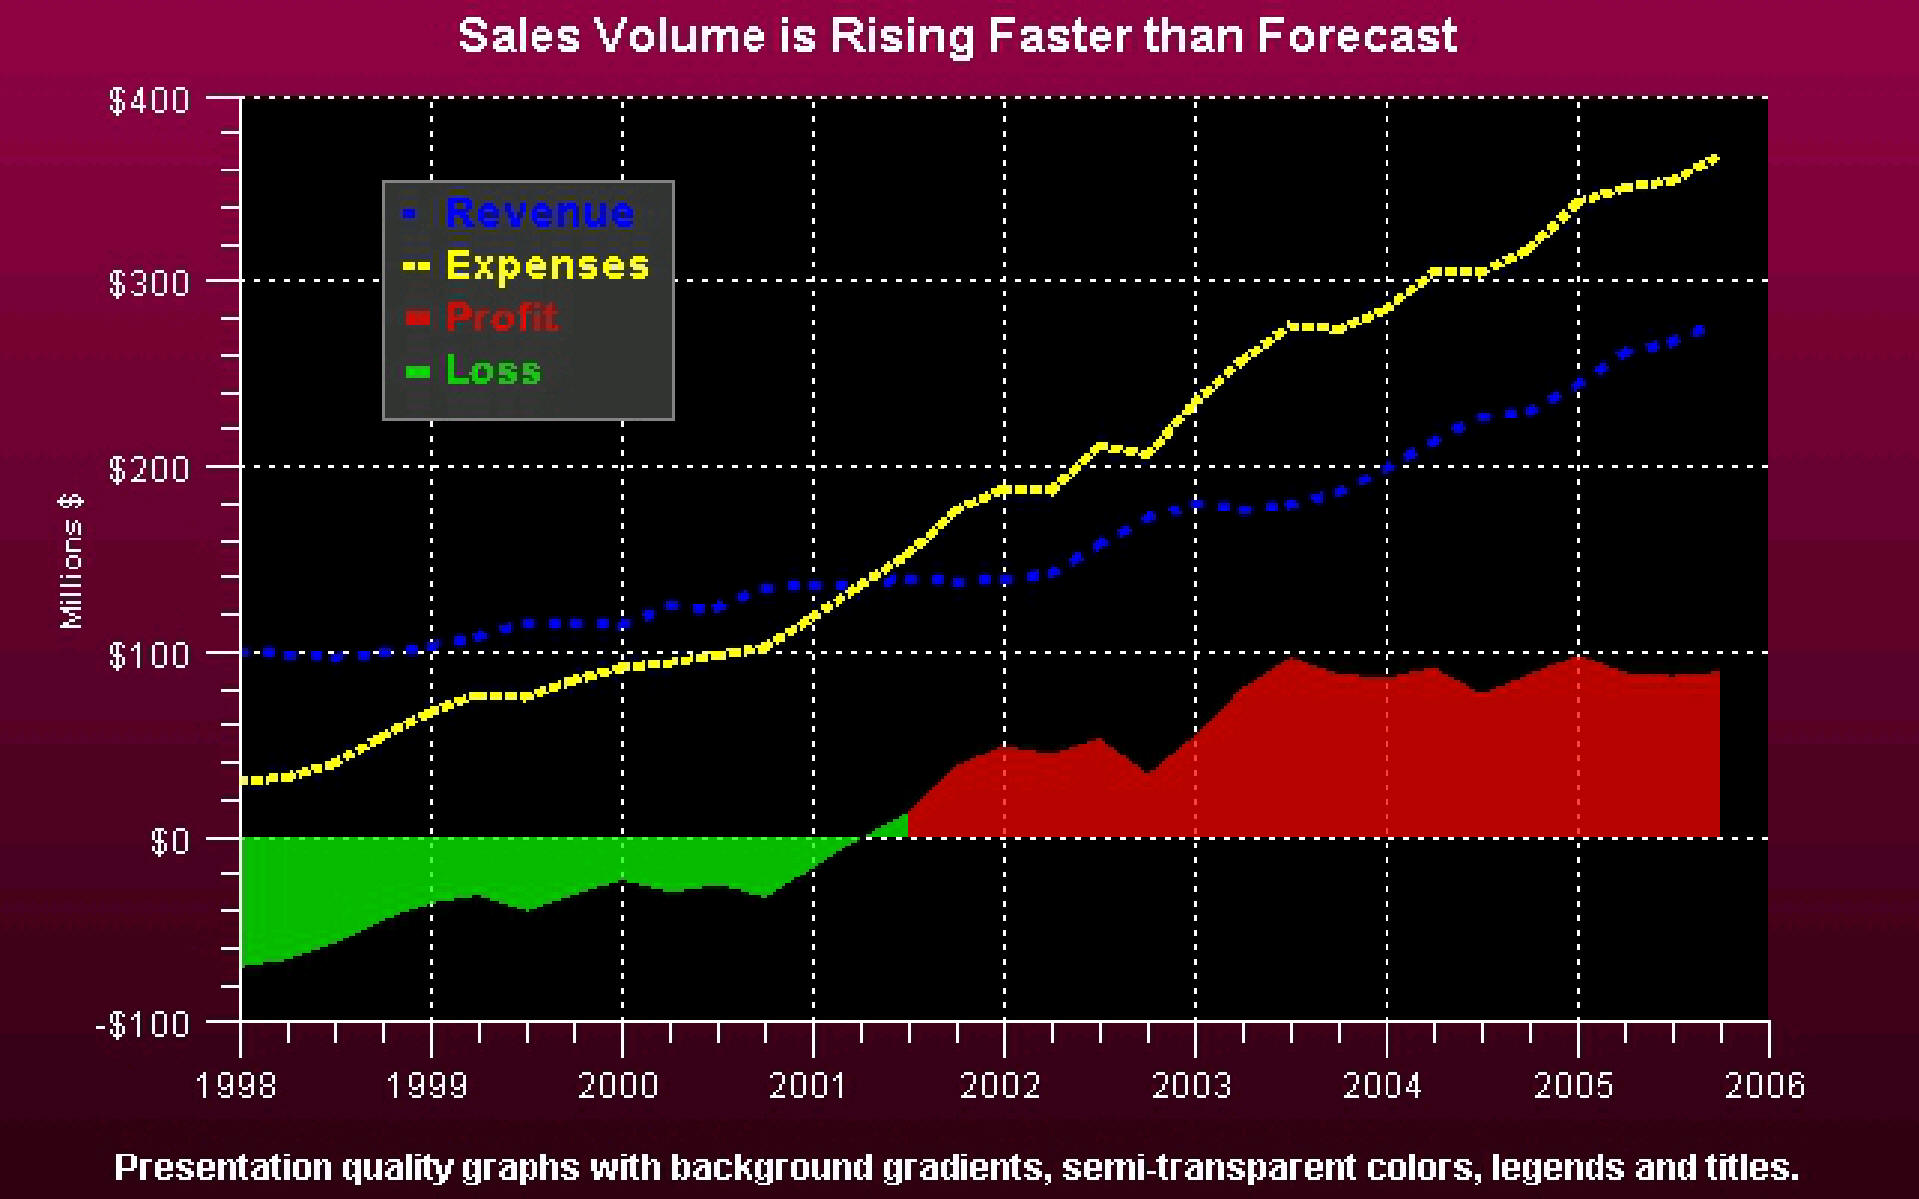
Business and Marketing Charting


The QCChart2D for JavaScript/TypeScript software represents an adaptation of the QCChart2D library to the JavaScript and the HTML5 user interface framework. The entire QCChart2D library is written using the TypeScript language, which is a superset of JavaScript. The resulting TypeScript code is transpiled into JavaScript, resulting in a pure JavaScript version of the library. The library can be called from JavaScript within a browser, from JavaScript files external to the browser, or by TypeScript files which have been transpiled into their JavaScript equivalents. The result is an easy to use, interactive, Charting package which will run on any computer which supports a modern browser.
Links
QCChart2D User Manual – View the QCChart2D for JavaScript/TypeScript user manual using Adobe Acrobat.
Frequently Asked Questions – See a collection of frequently asked questions concerning the QCChart2D for JavaScript/TypeScript software.
Download Trial Version (9 MB) – Download a full-featured, 30-day trial version. of the software. Have any questions ? Contact: info@quinn-curtis.com
Related Quinn-Curtis Products
| Product Platform | .Net | WPF | JavaScript/Typescript |
|---|---|---|---|
| QCChart2D | QCChart2D for .Net | QCChart2D for WPF | QCChart2D for JavaScript/Typescript |
| QCRTGraph | QCRTGraph for .Net | QCRTGraph for WPF | QCRTGraph for JavaScript/Typescript |
| QCSPCChart | QCSPCChart for .Net | QCSPCChart for WPF | QCSPCChart for JavaScript/Typescript |
Feature Summary
- Based on HTML5 – The software places charts in standard HTML5 Canvas elements, placed anywhere on the web page. As many canvas elements as you need can be combined on the same page, each with one or more charts.
- Develop under Windows or a Linux variant -Compatible with all JavaScript and/or TypeScript Development environments. We utilize Microsoft Visual Code for both Windows and Ubuntu.
- ES6 module loading – It uses the ES6 asynchronous module loading specification for JavaScript, and all JavaScript and all calls into the library can be localized to the module, preventing any namespace collision of function names.
- Self contained – No third party libraries needed – The software is entirely written in TypeScript, resulting in provide better reliablity, performance and scalability.
- Compatible with Angular – The library can be integrated into Angular apps, using a canvas element in an Angular HTML template, and the chart building code in the behind code TypeScript file.
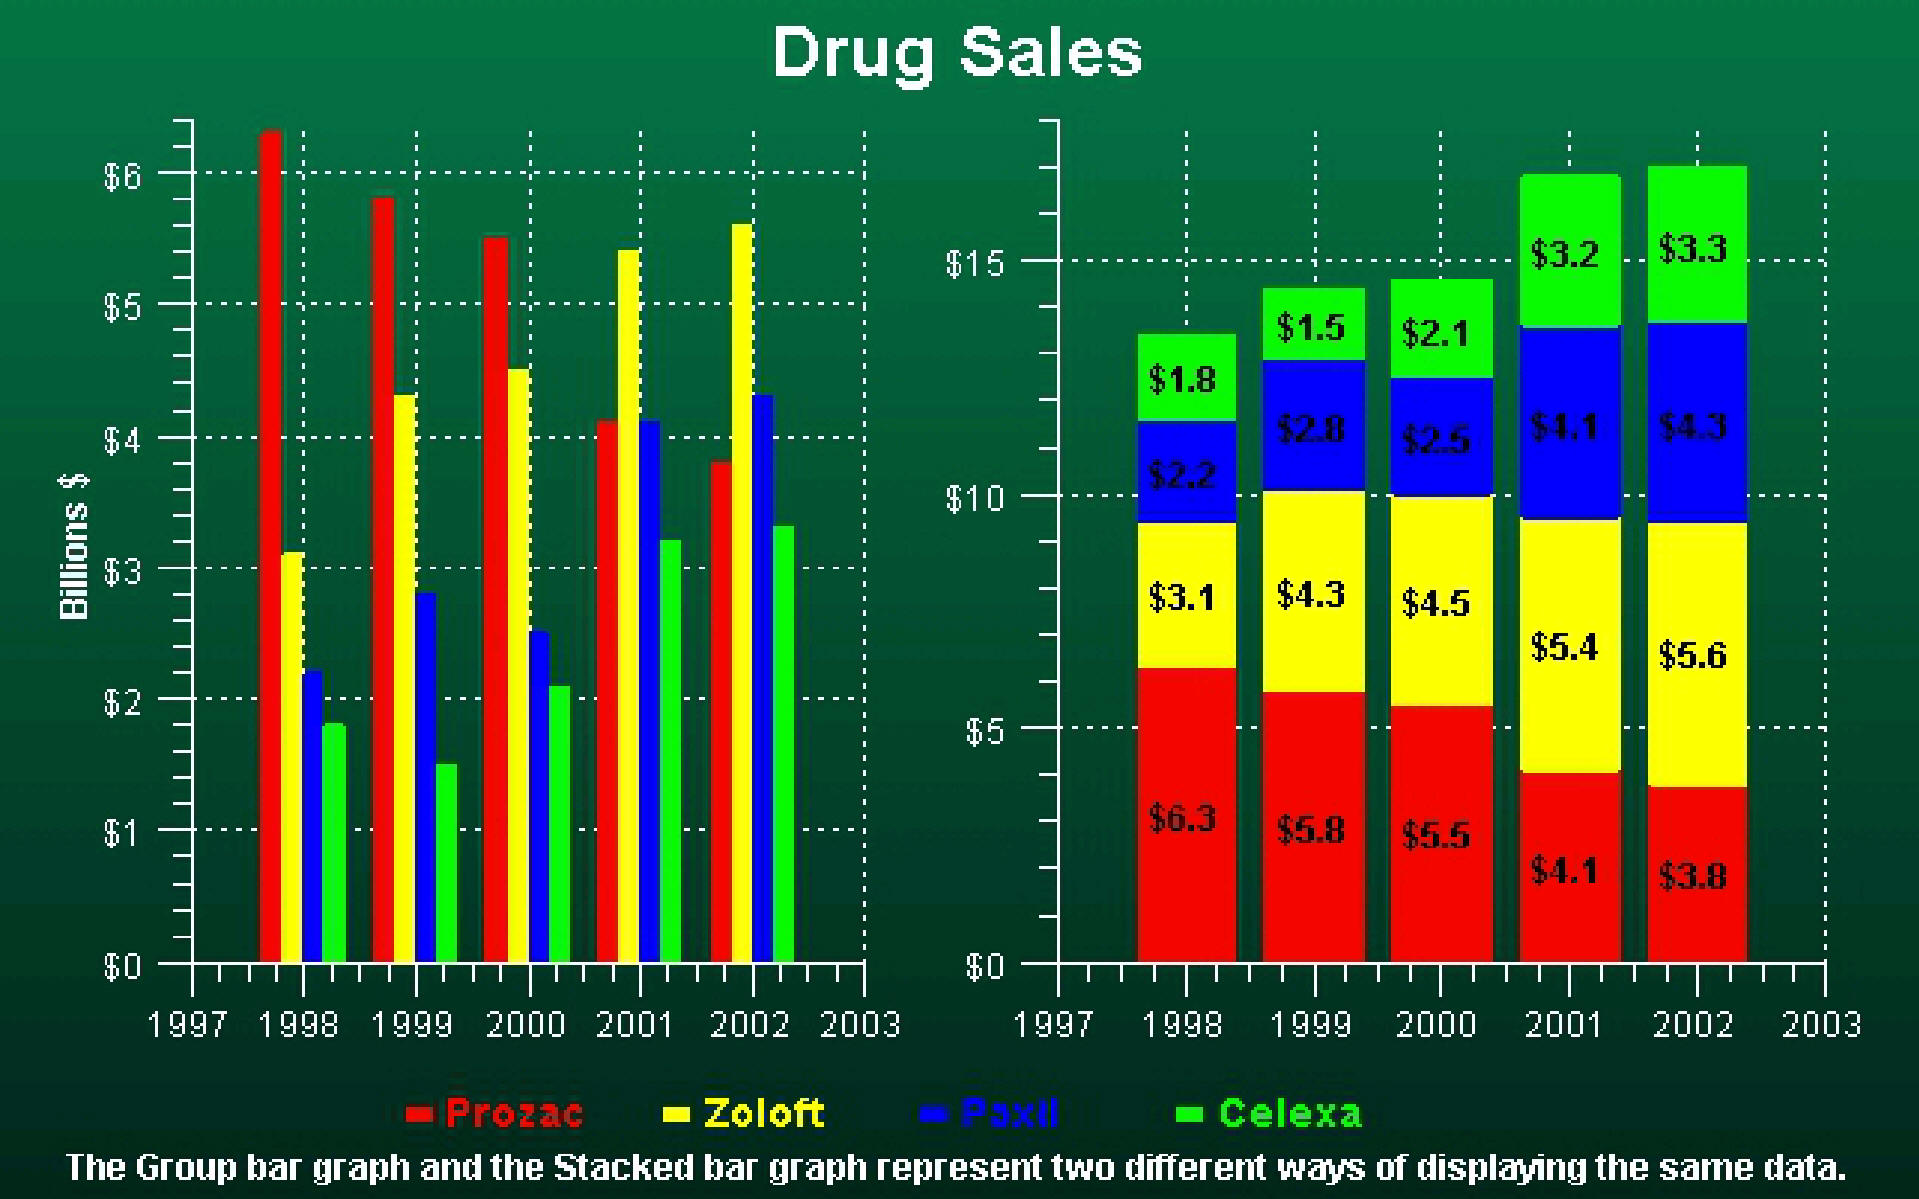
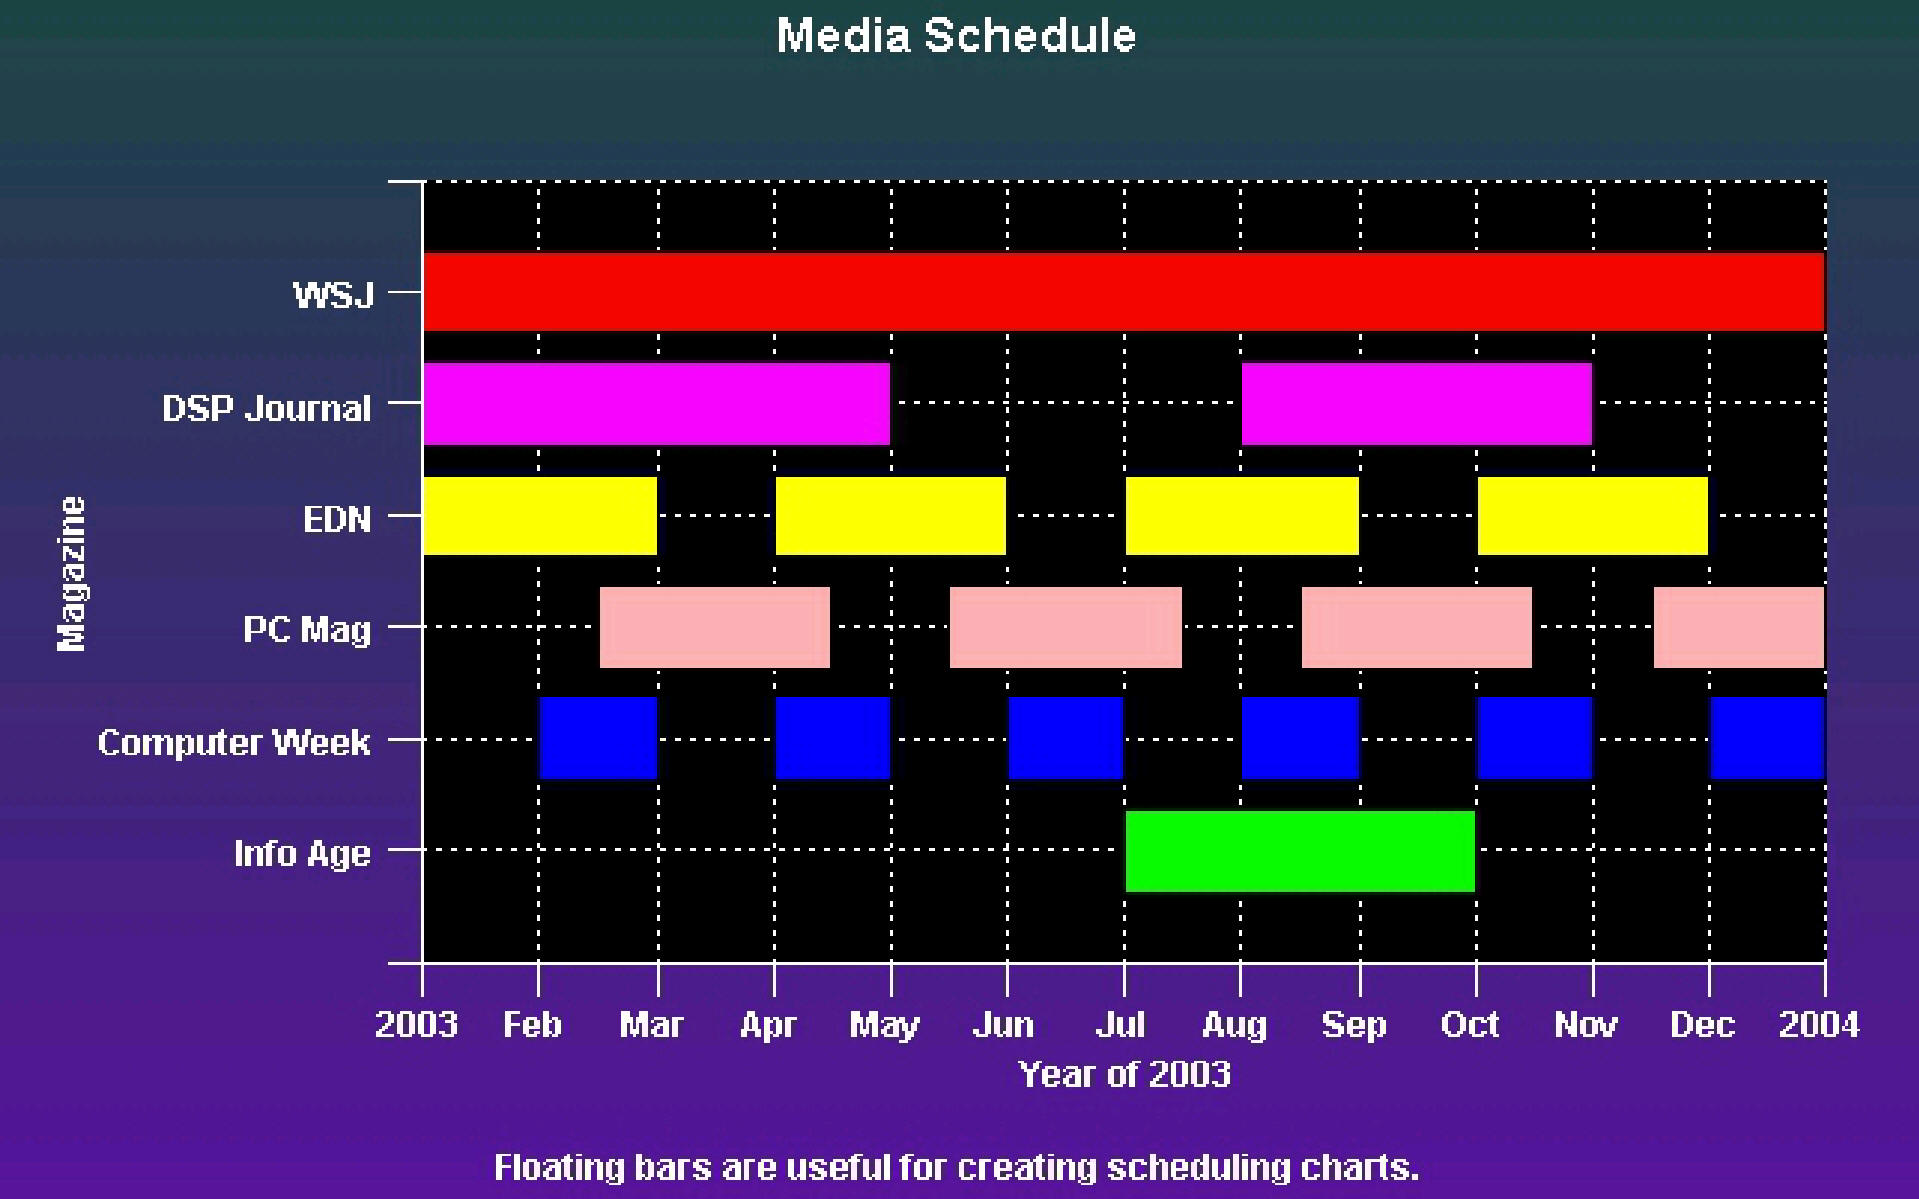
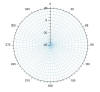
- Plot Types – Line plots, area plots, bar plots, line marker plots, floating bars, scatter plots, group plots, open-high-low-close plots, error bar plots, pie charts, candlestick plots, line gap plots, cell plots, histogram plots, bubble plots, polar plots, multi-line plots, stacked line plots, box-whisker plots, floating stacked bar plots, ring plots, antenna plots, versa plots.. An unlimited number of plot types can be combined in the same chart.
- Datasets – Datasets hold the data plotted in the chart. Charts can plot an unlimited number of datasets, each dataset can contain an unlimited number of data points. Datasets can hold numeric and JavaScript Date based data. Mark data points invalid, forcing a break in plotted lines.
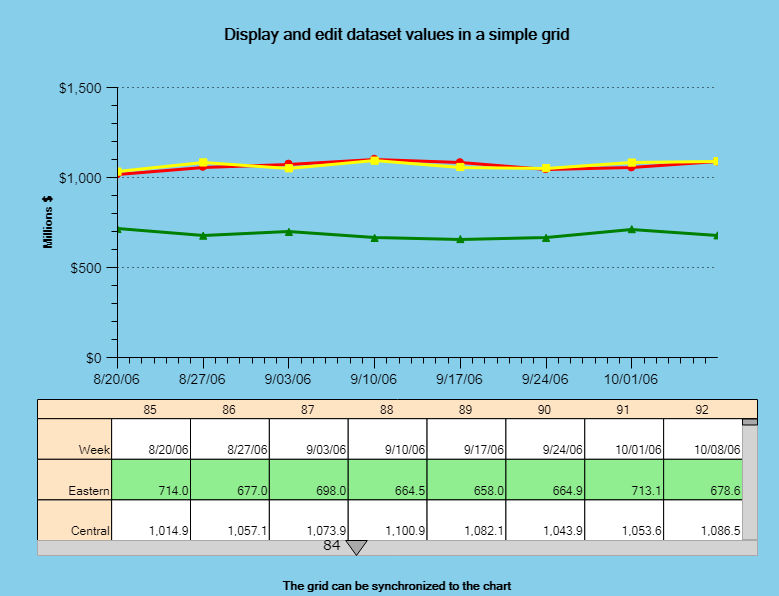
- Dataset Viewer – A new dataset viewer class will display simple and group datasets in a grid-like table. The grid can be positioned anywhere on the chart. Individual grid cells can be edited and the associated chart immediately updated using the synchronize feature.
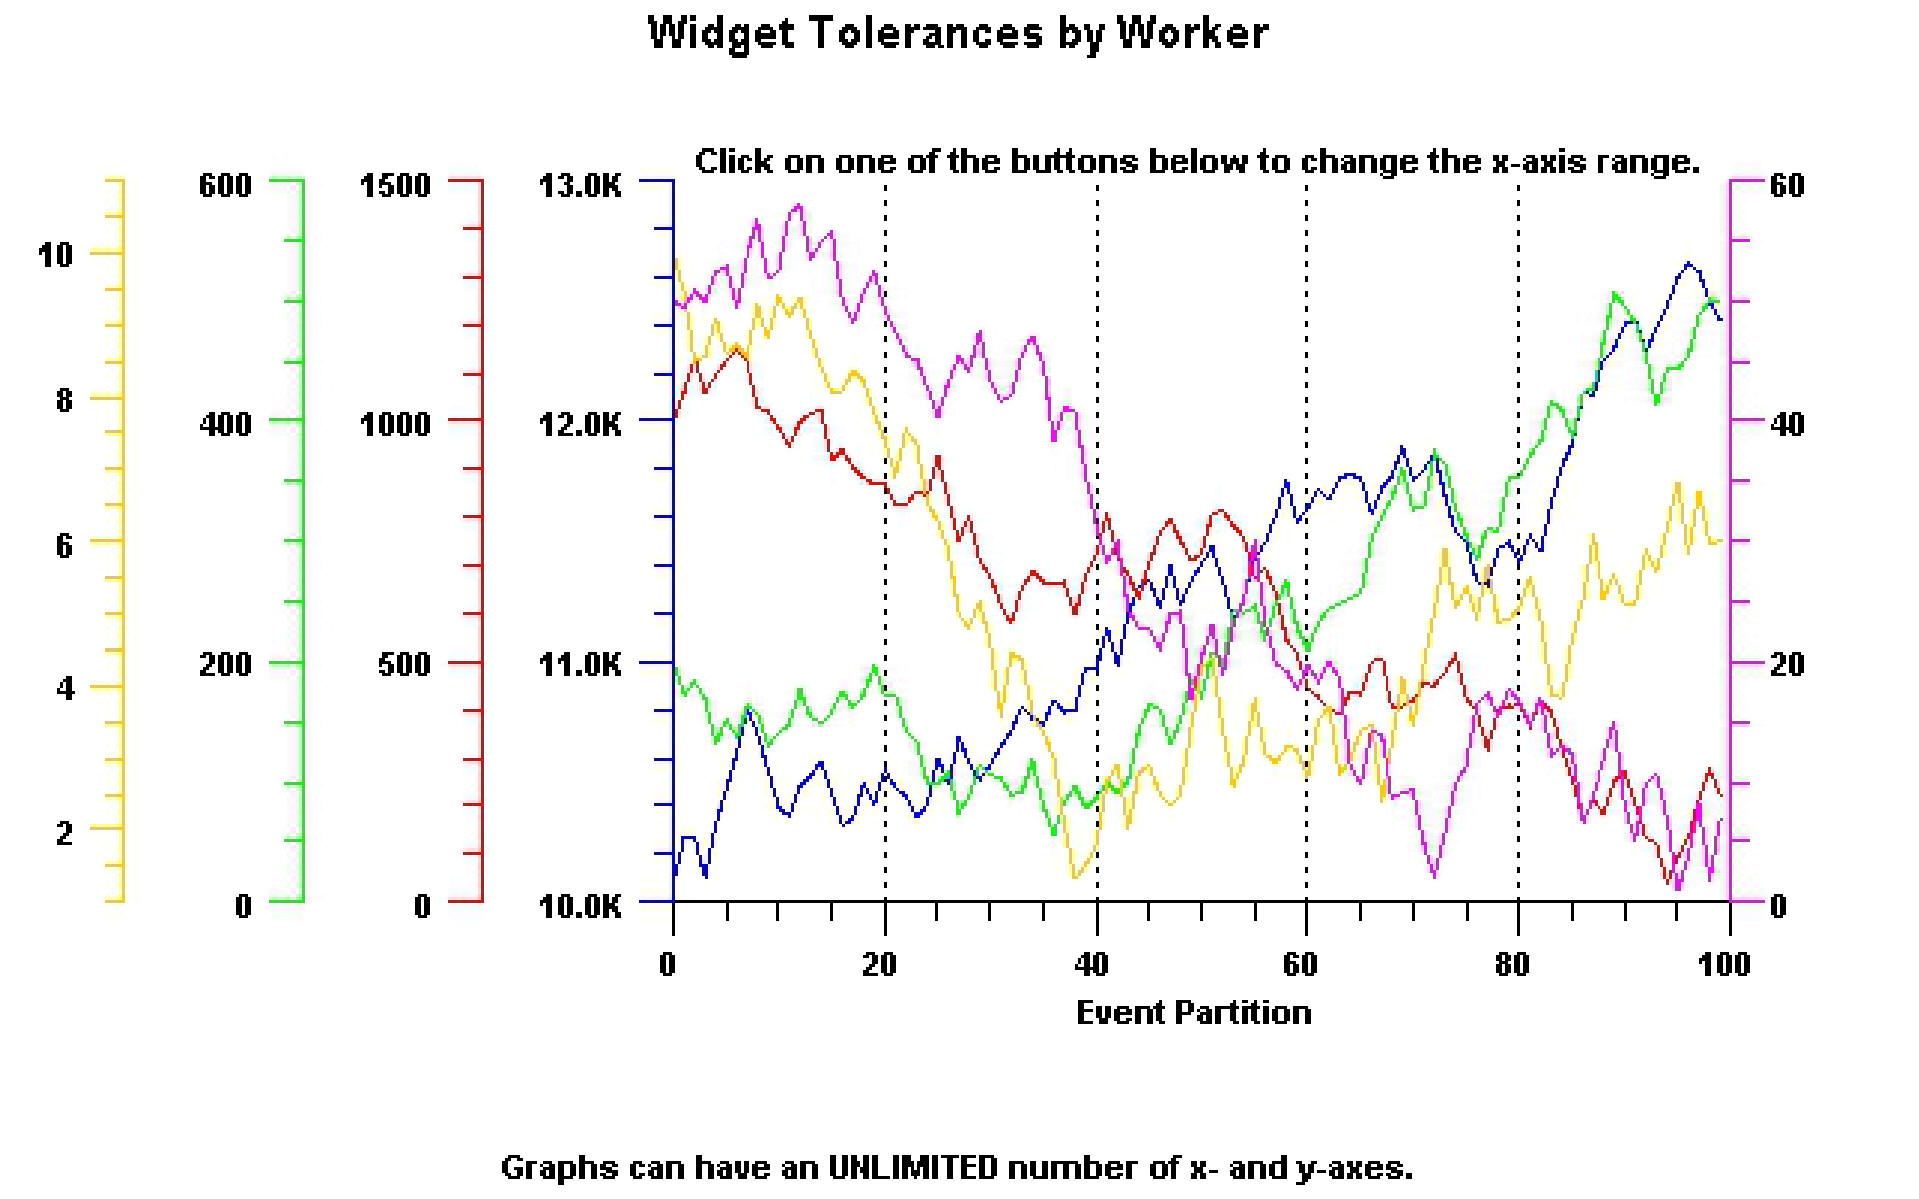
- Coordinate Systems – Linear, logarithmic, time/date and polar coordinate systems. An unlimited number of coordinate system, and axes, can be overlaid in the same plotting area of a graph.
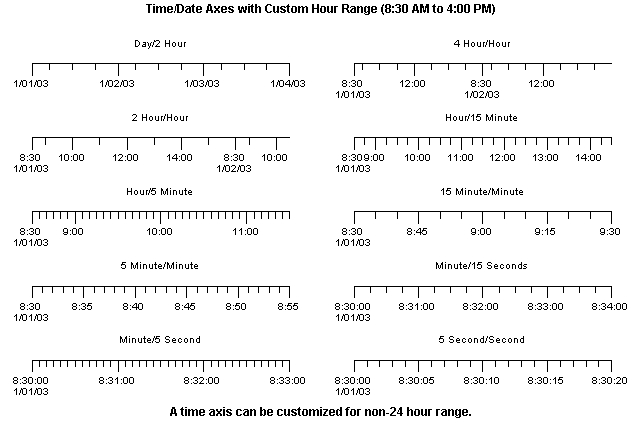
- Time and Date Coordinate Systems – The time/date scale is specified using JavaScript Date objects. The time/date scales take into account the varying number of days in months and years.
- Elapsed Time Coordinate System – The software supports elapsed time plotting,with a resolution of 1 millisecond. The elapsed time scale can be either horizontal or vertical.
- Event-Based Coordinate System – An Event-based charting further expands the plotting capability of QCChart2D – adding features important to the financial services industries. For more information see: An Event-based Coordinate System for Use in the Plotting of Discontinuous Time Data.
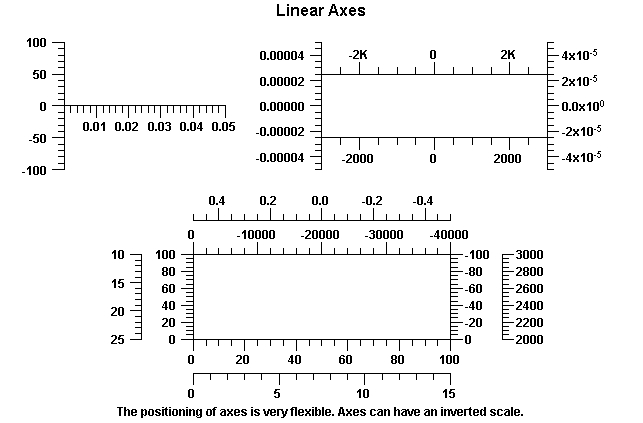
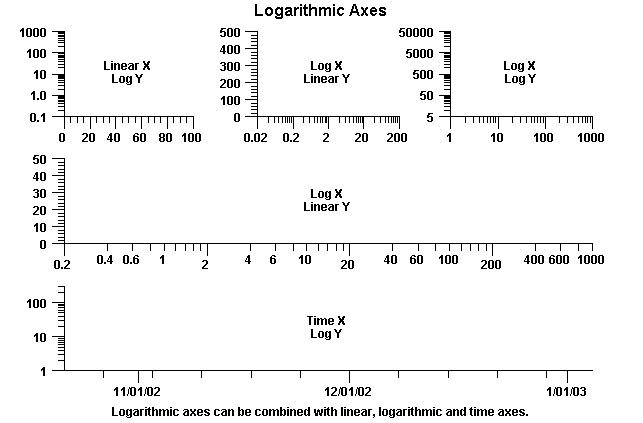
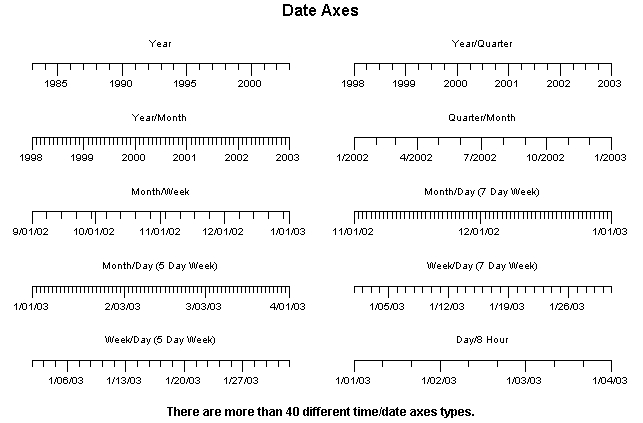
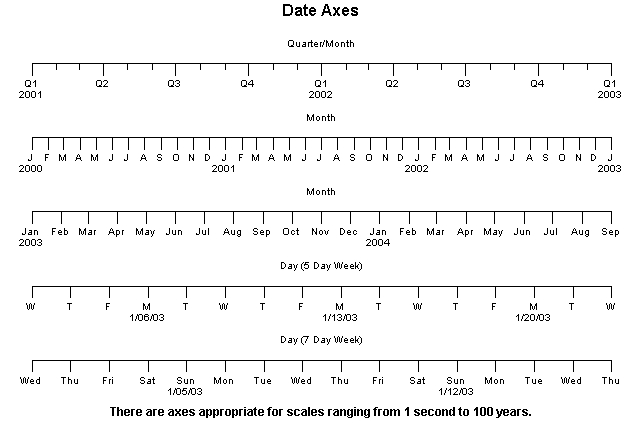


- Axis Types – Linear, logarithmic, time/date, elapsed time, event, antenna, and polar axis types. All axis types have manual and auto-scaling modes for setting axis ranges. Axis auto-scaling modes handle multiple datasets, group data and contour data. A chart can have an unlimited number of axes.
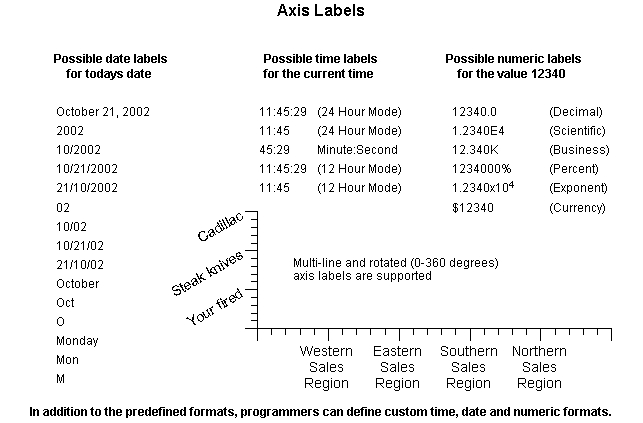
- Axis Labels – Axes can have decimal, exponential, time, date, elapsed time, string and multi-line labels. Programmers can define custom numeric and time/date axis labels.
- Chart Titles – Charts can have a main title, a subhead and a footer. Axes can have horizontal and vertical titles.
- Grid Options – Grid lines of any line style and color can highlight major and minor axis tick marks.
- Export Chart Images – You can retrieve an image representation of a chart as a URL string using the BufferedImage class
- Import HTML Image object – Use HTML Image objects as plot elements in a chart, or as a background object.
- Legends for All Plot Types – Position horizontal and vertical legends anywhere in a chart. A chart can have an unlimited number of legends.
- Mouse/Touch Support – An integrated driver combines mouse and touch events into a single set of event delegates, so you do not have to write two sets of code, one for desktop and the other for mobile. There are classes to locate and move chart objects like data plots, axes, titles, and legends.
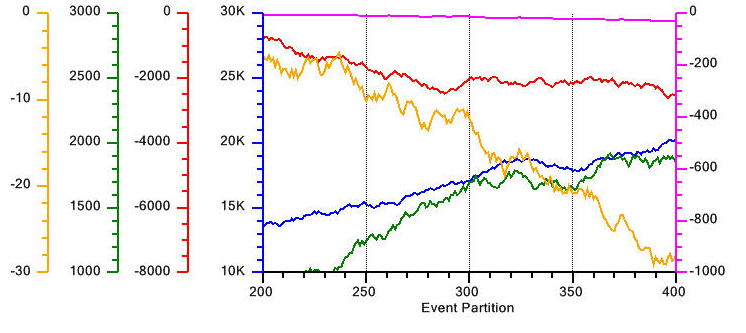
- Simple and Super Zooming – Zoom a simple xy axis pair, or simultaneous zoom an unlimited number of x- and y-axes.
- Panning – Use the new MoveCoordinates class to pan data in the x- and y-dimension. Click and drag in the plot area and rescale the graph proportionally.
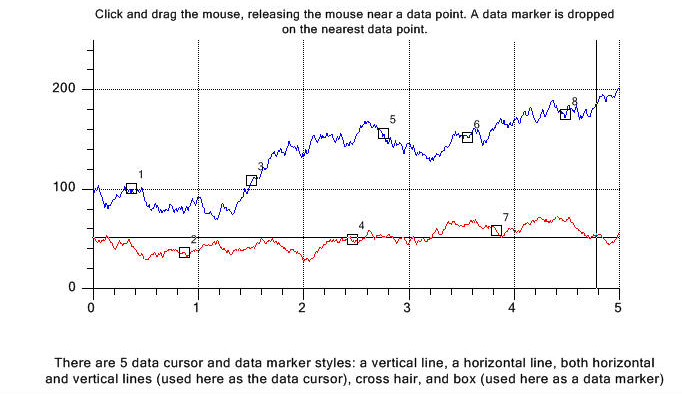
- Data Cursors – Data cursors are used to position the mouse cursor over data points in a plot.
- Data Markers – Drop special marker symbols on to the data presented in a graph, much like a bookmark in a word processing document.
- Graph Annotations – Add an unlimited number single and multi-line text objects, arrows and geometric objects to a chart.
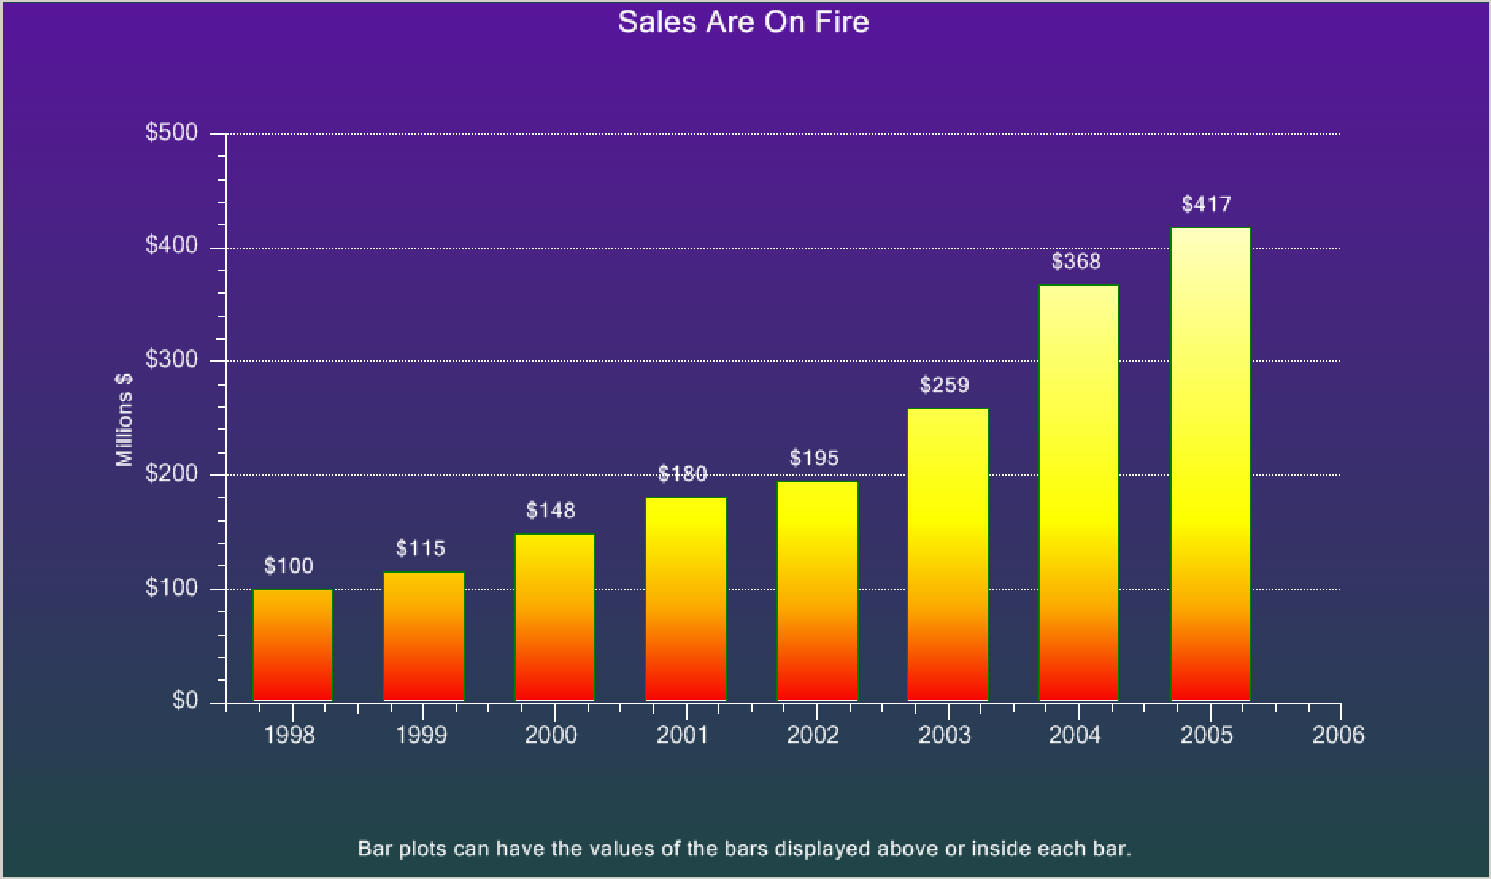

- Multi-Color Gradients – Bars and other area fill objects can be filled using multi-color gradients. Mult-color gradients can be mapped to the object, the plot are of the chart, or the entire graph.
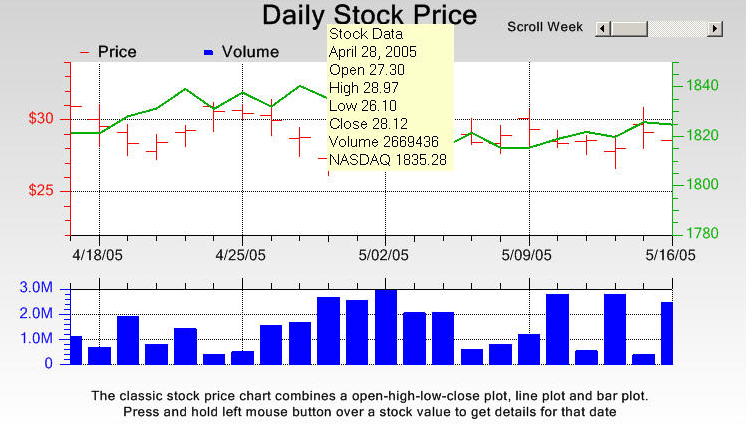
- Data ToolTips – Select a data point with the mouse and popup a tooltip window that displays the data x- and/or y-values for the data points. Programmers can create custom information displays for tooltip windows.
- Data Compression – Large datasets can be compressed, increasing display speed without loss of detail.
- Documentation and Demo/Example Programs – The software includes a comprehensive 300 page user manual with many programming examples and more than 80 complete example charts. Every programming example and example program is presented in JavaScript and TypeScript.
QCChart2D Developer Licensing
- Our license agreement can be found here.
- The QCChart2D Developer License is available in a Developers Version (model #JSTS-CHT-DEVR) that does not time out. Free updates for two years.
- The QCChart2D Developer License is licensed to a single individual. It cannot be used by multiple developers at the same company, unless a separate license is purchased for each person. Site licenses are also available. Contact sales@quinn-curtis.com with details of how many seats you wish to purchase and we will respond with a quote.
- The QCChart2D software does not use a redistributable license. The basic developer license permits you to include QCChart2D as part of your application and distribute an unlimited number royalty free.
QCChart2D Redistributable Licensing
- The QCChart2D Software does not use a redistributable license. The basic developer license permits you to include QCChart2D as part of your application and distribute an unlimited number of copies of your application, royalty free. We do not allow developers to use this software to create a graphics toolkit (a library or any type of graphics component that will be used in combination with a program development environment) for resale to other developers.
Custom Programming Services
- QCChart2D is an extremely powerful and flexible software package. It contains over 1000 methods and properties in more than 120 classes. The user manual and help file documentation are more than 1000 pages. This can be overwhelming to the average programmer who wants to start programming today and have the prototype of an application working in a week.
- The variety of user interfaces for charting applications is as diverse as the industries using the software. The end-user of an application at a mutual fund expects to interact with the chart in a manner different than that of an end-user in health care. The same can be said for other industries: semiconductors, quality control, teaching, biotechnology, etc.
- That is why we have written so many outstanding example programs, pulled from a wide variety of industries using many different styles of user interface.
- We know that your application may be similar to, but still uniquely different from any of our example programs. To that end we offer our programming services to write for you a custom example program that demonstrates how to code the chart format and user interface you want. That jump start to your project can save you many weeks of work and make you look like a chart programming genius. All you have to be able to do is describe in detail what you want the example to do.
- Using QCChart2D for JavaScript/TypeScript, our range of expertise includes JavaScript and TypeScipt programming language for basic web applications and ASP.net. We can adpat the library to any framework which supports HTML5 and JavaScript. For more information or a quote, please contact our sales department at sales@quinn-curtis.com.
Doesn’t have the features you need ? Let us know what those are so we can add them in a subsequent release. Contact: info@quinn-curtis.com
Ordering Information
Click here to go to Download Ordering
| Description | Model | Price |
| QCChart2D JavaScript/TypeScript Developer Software | JSTS-CHT-DEVR | $400 |