Products
Products
Programming Tools
See our newest programming tools for JavaScript and TypeScript here.
QCSPCChart

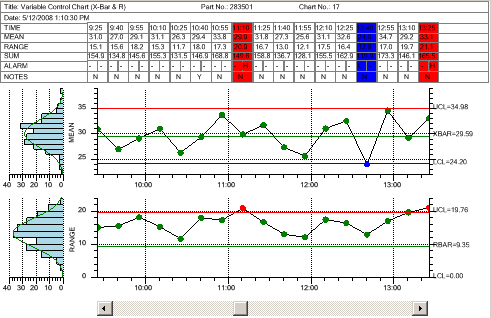
The QCSPCChart SPC Control Chart Tools software is an object oriented toolkit aimed at developers who want to add static and dynamic quality control charts to their workstation and web applications. Typical users are SPC engineers and other quality control professionals creating applications that will be used to monitor critical quality factors in manufacturing, process, and service industries. The toolkit includes templates for the most common SPC control chart types: variable control charts (X-Bar R, X-Bar Sigma, Individual Range, Median Range, EWMA, MA, MAMR, MAMS and CuSum charts), attribute control charts (p-, np-, c-, u-, and DPMO charts), frequency histograms, probability charts and Pareto diagrams. The software will automatically calculate SPC control limits using historical data for the supported variable control chart and attribute control chart types. Alarms can be generated for standard +3 sigma control limits, or standard SPC rule sets (WECO, Nelson, Juran, Hughes, Gitlow, AAIG, Westgard and Duncan). It will also calculate process capability ratios (Cp, Cpl, Cpu, Cpk and Cpm) and process performance indices (Pp, Ppl, Ppu and Ppk). Versions available for .Net (C#), WPF (VB and C#) and JavaScript/TypeScript. Full developer versions for $400 – $600.
QCRTGraph
The QCRTGraph Real-Time Graphics Tools toolkit is for developers who want to add sophisticated real-time graphics to their workstation and web based applications. It is designed for on-the-fly rendering of the real-time data using new specialized classes for scrolling graphs, gauges (bar graphs), meters, annunciators and text. Advanced user interface features such as zooming and tool-tips can used with real-time scrolling charts. A process variable class manages real-time data, an unlimited number of alarms, and data archiving. Real-Time displays can be sent to supported output devices at the resolution of the device, creating presentation quality printouts, slides, or transparencies. Versions available for .Net (C#), WPF (C#)and JavaScript/TypeScript. Full developer versions for $400 – $600.
QCChart2D

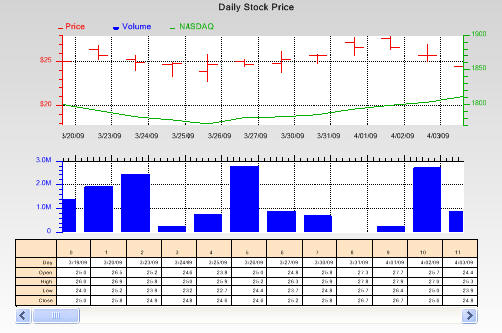
The QCChart2D charting toolkit is for developers who want to add sophisticated interactive charting graphics to their applications and web sites. The toolkit includes support for linear, logarithmic, antenna and polar coordinate systems used by engineering and scientific end users. It also includes support for advanced time/date and elapsed time, coordinate systems required by business end users. Advanced user interface functions allow users to interact with applications using the mouse: adding annotations, selecting, marking and moving data points, drilldown, tooltips and zooming into a particular chart region. Versions available for .Net (C#), WPF (C#) and JavaScript/TypeScript. Full developer versions for $250 – $400.
.Net Products for C# and Visual Basic
For .Net
QCChart2D Charting Tools for .Net
QCRTGraph Real-Time Graphics Tools for .Net
QCSPCChart SPC Control Chart Tools for .Net
For WPF
QCChart2D for WPF Charting Tools
QCRTGraph WPF Real-Time Graphics Tools
QCSPCChart SPC Control Chart Tools for WPF
JavaScript/TypeScript Products
QCSPCChart SPC Control Chart Tools for JavaScript/TypeScript
QCChart2D Charting Tools for JavaScript/TypeScript
QCRTGraph Real-Time Graphics Tools for JavaScript/TypeScript
Affiliated Websites
Legacy Products
The products below are no longer included in our ordering system. You can contact us at sales@quinn-curtis.com if you have a situation where you must have one of these products. They are sold without support however.
For Windows Apps (UWP)
A replacement for .Net CF, Windows Apps (also known as UWP Apps) was meant for the smaller, dedicated devices such as tables, phones, and dedicated OEM applications. But it never caught on.
QCChart2D Charting Tools for Windows Apps
QCRTGraph Real-Time Graphics Tools for Windows Apps
QCSPCChart SPC Control Chart Tools for Windows Apps
For Silverlight
A good idea at the time, Microsoft announced it was discontinuing Silverlight in 2012, and no longer supports it with their Windows 10 Edge browser. So new development using Silverlight is pretty much non-existent.
QCChart2D Charting Tools for Silverlight
QCRTGraph Real-Time Graphics Tools for Silverlight
QCSPCChart SPC Control Chart Tools for Silverlight
For .Net Compact Framework (.Net CF)
While .Net Compact Framework has users in dedicated OEM applications, the widespread market seemed over to us in 2008. Android and IOS are now dominate in the phone, tablet and the Internet of Things market.
QCMatPack CF Matrix and Numerical Analysis for .Net Compact Framework
QCChart2D CF Charting Tools for .Net Compact Framework
QCRTGraph CF Real-Time Graphics Tools for .Net Compact Framework
QCSPCChart CF SPC Control Chart Tools for .Net Compact Framework
Miscellaneous
QCMatPack Matrix and Numerical Analysis for Java
QCChart3D 3D Charting Tools for Java
QCMatPack Matrix and Numerical Analysis for .Net
QCChart3D 3D Charting Tools for .Net
Even Older Windows and DOS software
The Windows and DOS products below are legacy products and have not been updated since 2002. They are sold as-is. Technical support for these products is non-existent.
Windows Products for C, C++, Visual Basic and Delphi
Real-Time Graphics Tools for Windows
Charting Tools for Windows
Graphics Class Libraries for MFC
3D++ Class Library for MFC
Real-Time Graphics ActiveX Controls
Charting ActiveX Control
Data Analysis ActiveX Controls
DOS Products for C, and Pascal
Real-Time Graphics Tools and User Interface Tools
Science, Engineering, and Graphics Tools
