
JavaScript/TypeScript Products
JavaScript/TypeScript Products
SPC Control Chart Tools for JavaScript/TypeScript
Model # JSTS-SPC2-DEVR
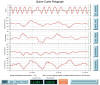
Above is an interactive XBar-R chart created using the SPC Control Chart Tools for JavaScript/TypeScript tools. The scrollbar, tool tips, and toggle buttons on the right all work to customize the chart.
Written around the HTML5 Canvas graphics framework, and organized as JavaScript ES6 module imports , the resulting JavaScript library is completely independent of all third part libraries. The result is an easy to use, interactive, SPC Charting package which will run on any computer which supports a modern browser, running under Windows or Linux.
For a detailed list of the features found in the software see the product description at: QCSPCChart for JavaScript/TypeScript .
QCRTGraph for JavaScript/TypeScript
Model # JSTS-RTG-DEVR
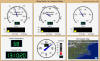
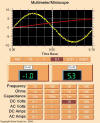
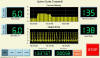
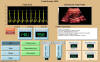
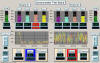
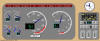
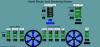

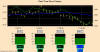
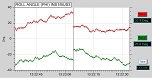
Above is an interactive process monitoring display simulation created using the Real-Time Graphics Tools for JavaScript/TypeScript. The trackbars and buttons all work to control the simulation.
Add scrolling graphs, meters, bar graphs, gauges, annunciators, dynamic text, and UI controls to web pages using JavaScript and TypeScript.
The QCRTGraph for JavaScript/TypeScript software represents an adaptation of the QCRTGraph real-time graphics library to the JavaScript and the HTML5 user interface framework. The library can be called from JavaScript within a browser, from JavaScript files external to the browser, or by TypeScript files which have been transpiled into their JavaScript equivalents.
For a detailed list of the features found in the software see the product description at: QCRTGraph for JavaScript/TypeScript .
QCChart2D Charting Tools for JavaScript/TypeScript
Model # JSTS-CHT-DEVR
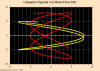
Above is an interactive Candlestick created using the QCChart2D Charting Tools for JavaScript/TypeScript tools.
Written around the HTML5 Canvas graphics framework, and organized as JavaScript ES6 module imports , the resulting JavaScript library is completely independent of all third part libraries. The result is an easy to use, interactive, Charting package which will run on any computer which supports a modern browser, running under Windows or Linux.
For a detailed list of the features found in the software see the product description at: QCChart2D for JavaScript/TypeScript .